Who's going to score?
It's the question every supporter asks before kick-off. Will Wainiqolo bag another brace? Will Bielle-Biarrey find the corner? Rather than going on gut feeling, I built a model that estimates the try-scoring probability for every starting player — before the game begins.
In this article I walk through the methodology, the data, the 2025-2026 season results, and some surprising insights from the backtest.
Live predictions are available on the Analytics page 👈
1. The data
The model draws on three data sources collected for every TOP 14 and PRO D2 match:
Match sheets: for each game I gather the official line-up (15 starters), individual player statistics, and the full match timeline (tries, cards, substitutions).
Historical results: all matches across multiple seasons, including scores and team statistics.
Official standings: points scored and conceded per round, used as a proxy for each team's offensive and defensive level.
2. Model features
The model uses 18 features to estimate the probability that a given player scores in a given match.
Player-level
player_try_rate: rolling average of tries scored over the last 10 games (each prediction uses only past matches)games_played_season: games played this season — a proxy for the coach's trust and the player's consistency
Team-level
team_attack_rate: average tries scored per game over the last 10 gamesopp_defense_rate: average tries conceded by the opponent per gameexpected_match_tries: sum of the two above — a measure of how open the game is likely to be. A tight Toulouse-Racing clash won't create the same opportunities as two free-scoring sides going at each otheris_home: home advantage, measurable even for individual try scorers
Relative strength
elo_teamandelo_diff: team ELO rating and differential against the opponentrank_pts_scored_pg,rank_opp_conceded_pg: points scored/conceded per game in the standings
Position: 8 binary variables — wing, fullback, centre, halfback, flanker, back row, lock, front row.
3. The model
Architecture
I use logistic regression with balanced class weights to handle the natural imbalance: a player only scores in roughly 20% of their matches. The model is trained on all seasons prior to 2025-2026, then evaluated on the current season.
Normalisation
Raw probabilities are normalised per team so that their sum equals the expected number of tries in the match. If a team is expected to score 3 tries and one winger captures most of the raw probability mass, his normalised score can reach 50-60%.
Platt Scaling
Platt scaling is a calibration technique introduced by John Platt (1999). The idea: after training the main model, a second sigmoid function is fitted that maps the model's raw outputs to better-calibrated probabilities. Concretely, if the model tends to be overconfident at 70%, the calibration pulls it toward a more realistic value.
In my implementation, I use 5-fold cross-validation (CalibratedClassifierCV, method='sigmoid', cv=5): five independent models are trained on different data subsets and their predictions averaged. This ensemble effect improves player ranking (AUC +9%) beyond simple calibration alone.
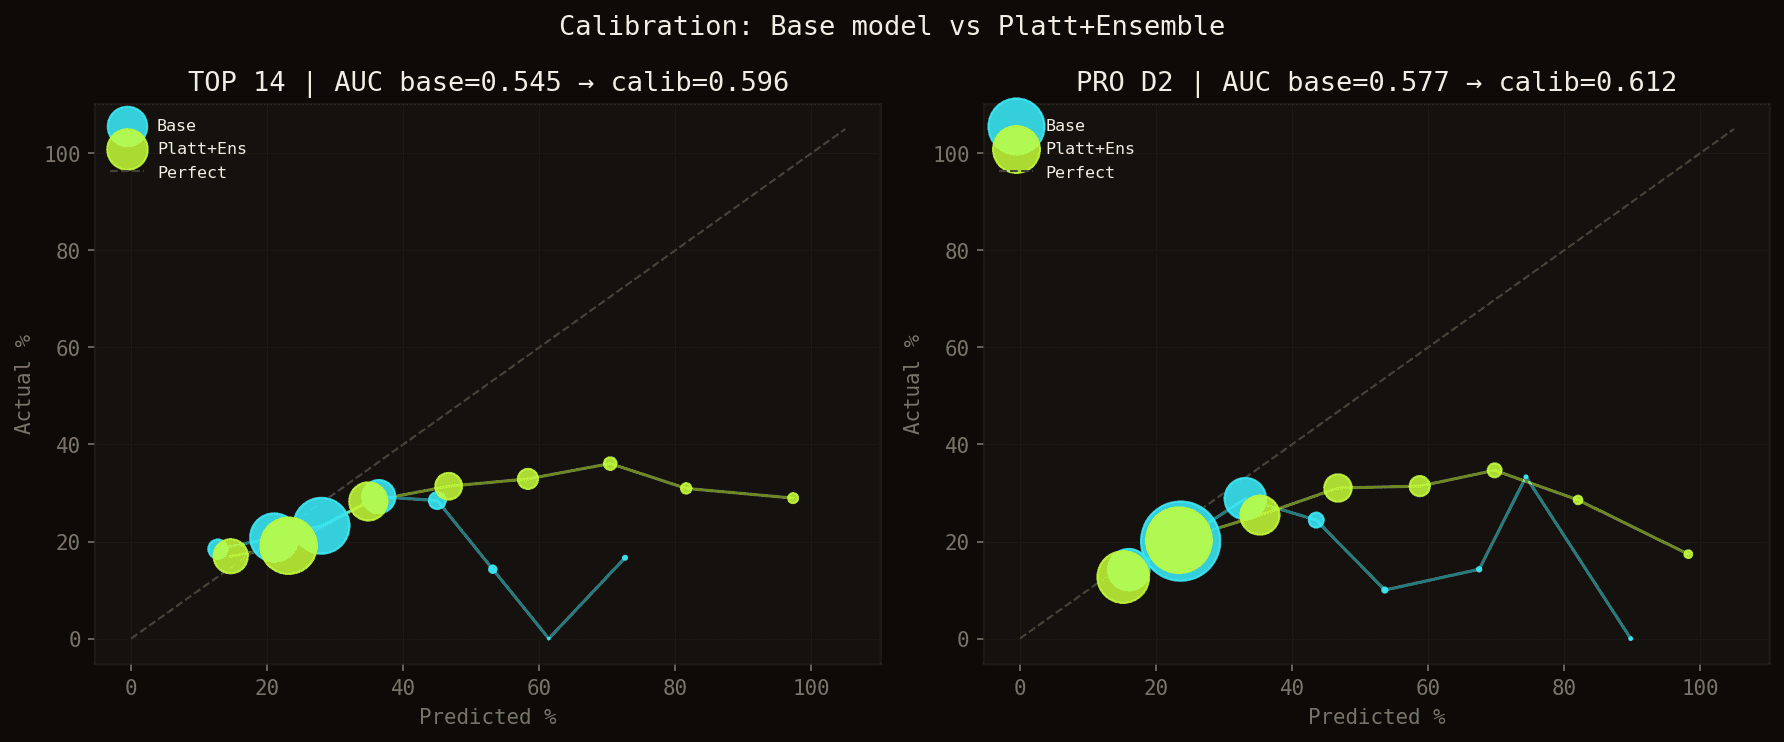
Calibration curves: base model (blue) vs Platt + ensemble (green). AUC improves from 0.555 to 0.596 in TOP 14, and from 0.590 to 0.612 in PRO D2.
⚠️ The scores displayed are relative rankings, not absolute probabilities. A player at 60% won't score in 60% of their games — it means they are the most likely scorer for their team in that specific match-up.
Feature Importance
Logistic regression is fully interpretable: after standardisation (StandardScaler), every model coefficient is directly comparable. Each value represents the effect of one standard deviation of that feature on the log-odds of scoring a try, holding all other features constant.
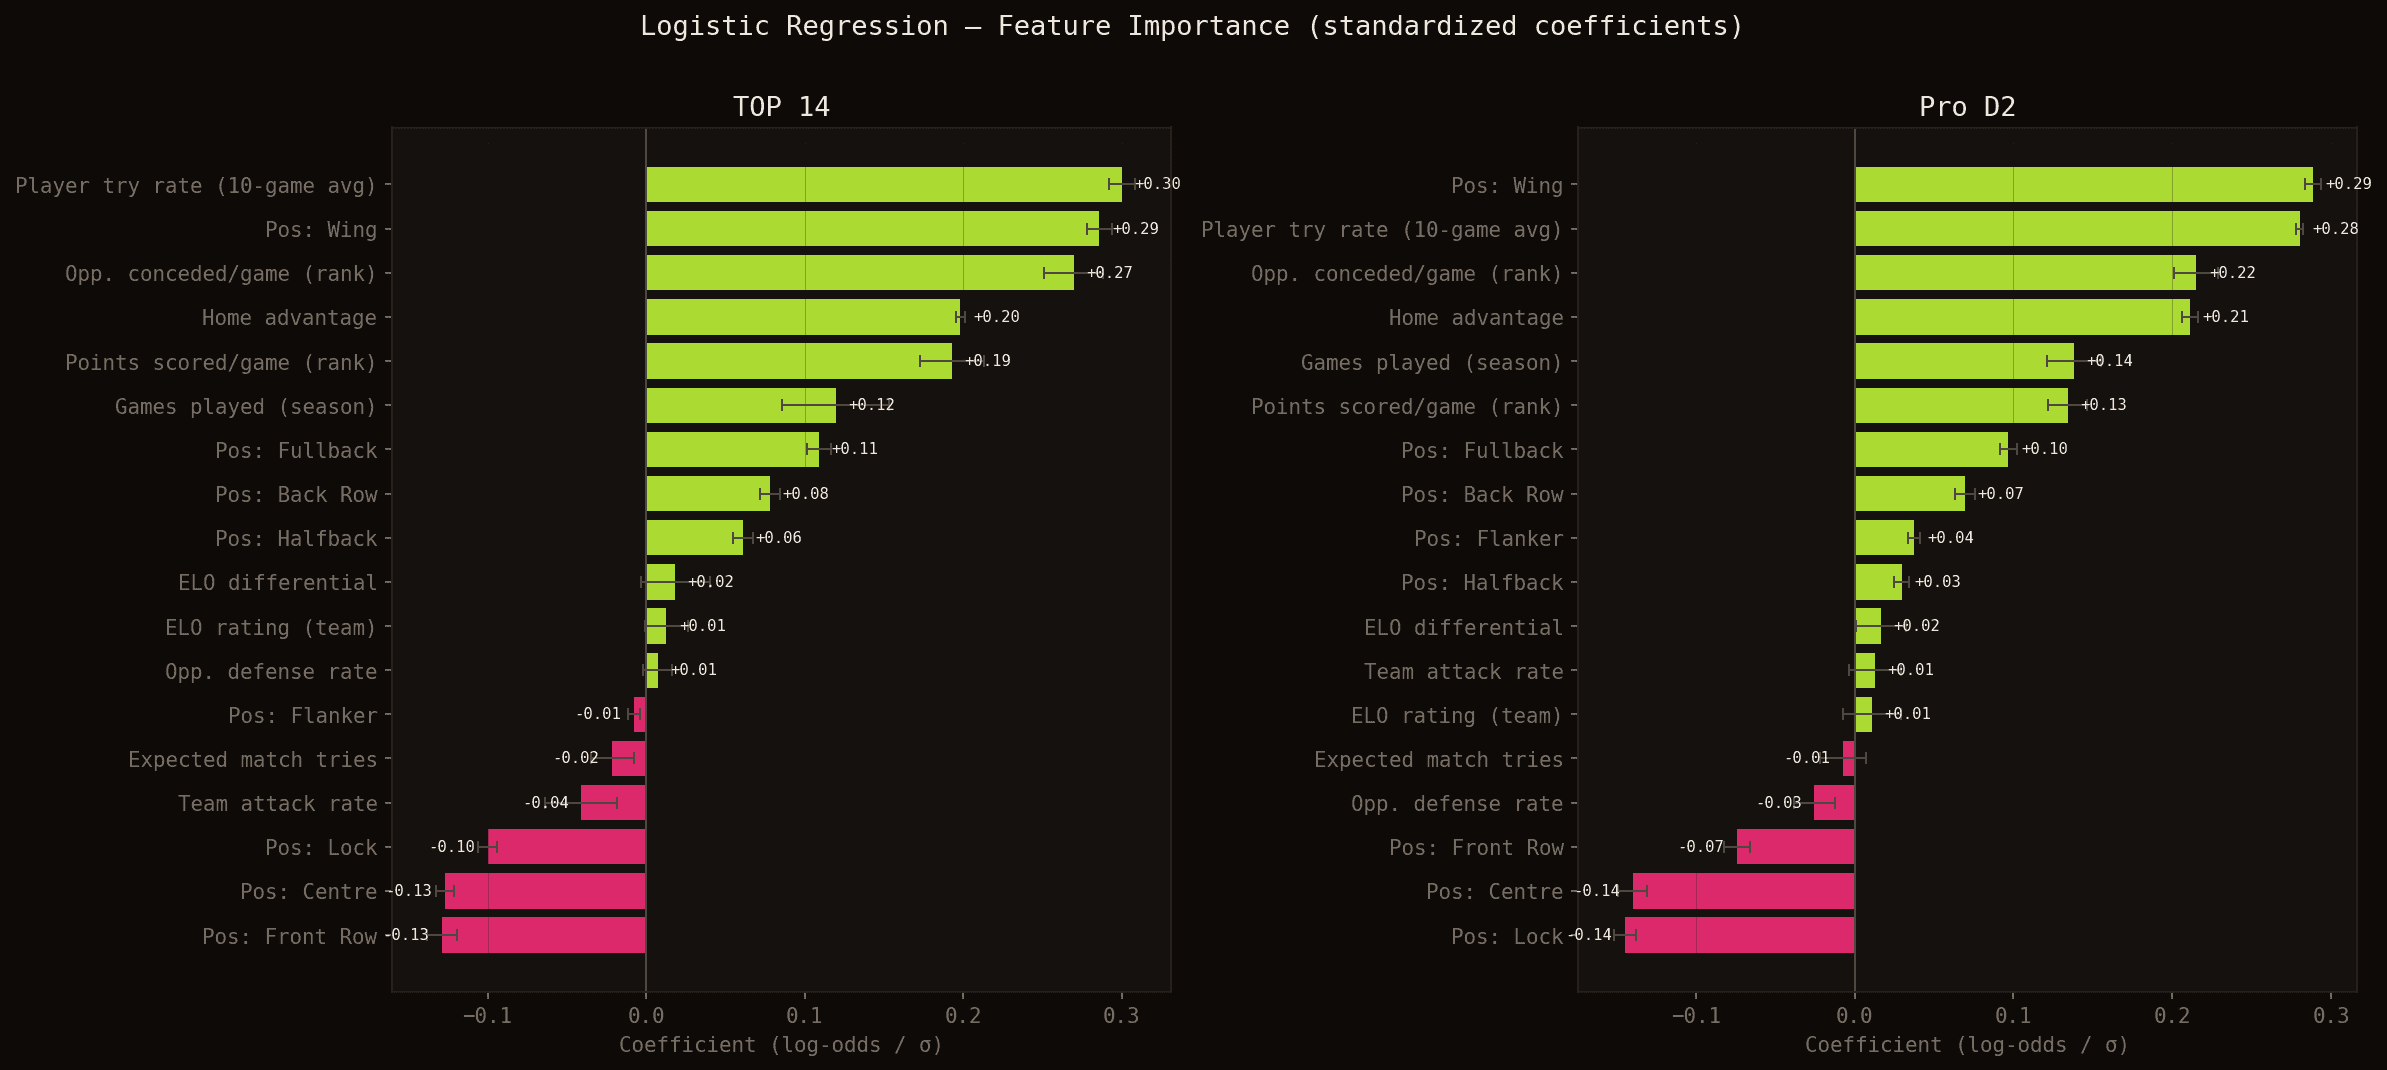
Standardised model coefficients for TOP 14 (left) and Pro D2 (right). Green = increases the probability of scoring; red = decreases it.
Five findings stand out clearly:
1. Individual history dominates. player_try_rate — the 10-game rolling try average — is the strongest individual signal (+0.30 in TOP 14, +0.28 in Pro D2). Players who score consistently keep scoring: regularity is structural, not random.
2. Position is a blueprint. Being a wing is almost as predictive as individual history (+0.29 in TOP 14). Conversely, lock (-0.10 / -0.14) and front row (-0.13 / -0.07) carry negative coefficients. These capture each position's intrinsic role in the game — wingers finish phases, props create them.
3. Standings beat rolling averages. Among collective context features, the standings-based indicators (rank_pts_scored_pg, rank_opp_conceded_pg) have two to four times the impact of raw rolling averages (team_attack_rate, opp_defense_rate). Season-long rankings are a more stable quality proxy than the last 10 games.
4. Home advantage is real and sizeable. The is_home coefficient is +0.20 in TOP 14 and +0.21 in Pro D2 — one of the most consistent and strongest effects among non-positional features. Playing at home increases try-scoring probability even at the individual player level.
5. ELO adds little at the player level. The ELO differential between the two teams has a coefficient of only +0.018 — the weakest of all continuous features. At match scale, relative team strength is already captured by the standings variables; at the player level, it becomes marginal.
These results are remarkably stable across TOP 14 and Pro D2, which gives the findings added robustness.
4. Results — 2025-2026 season
How to read AUC and top-k hit rate
AUC (Area Under the ROC Curve) is the standard metric for ranking models. Here's the intuitive interpretation: imagine randomly picking one player who scored and one who didn't in the same match. AUC is the probability that the model gave the scorer a higher score. An AUC of 0.5 means the model performs no better than chance; 1.0 means perfect. Our 0.596 in TOP 14 and 0.612 in PRO D2 mean the model correctly identifies the scorer in nearly 60% of such comparisons — on an inherently difficult problem where rugby keeps all its unpredictability.
The top-k hit rate is more practical: in what percentage of matches did at least one of the model's top-k picks actually score a try?
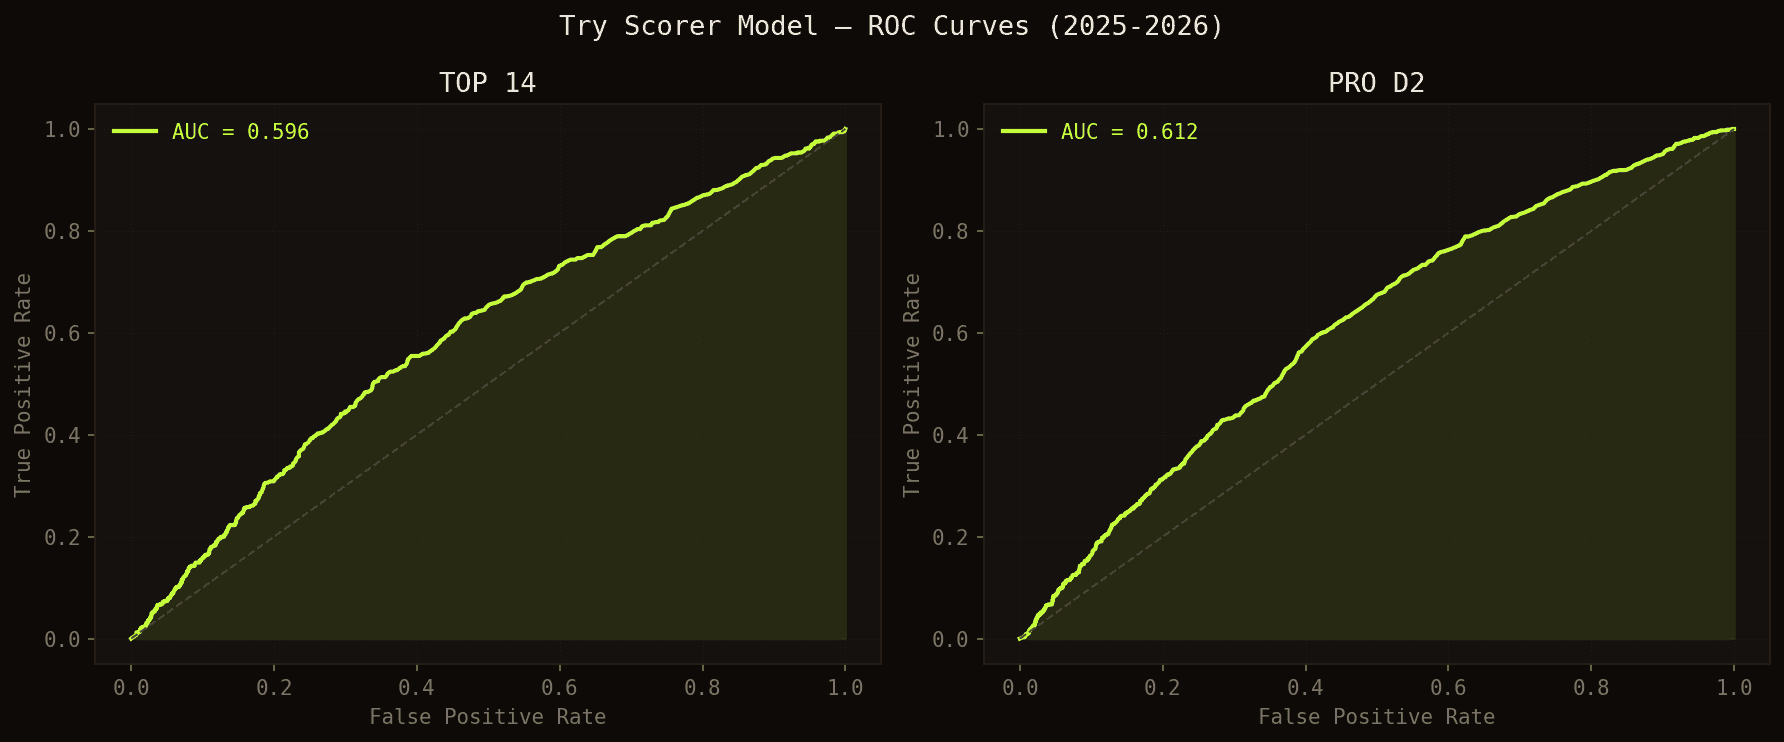
ROC curves — the further the curve from the diagonal, the better the model.
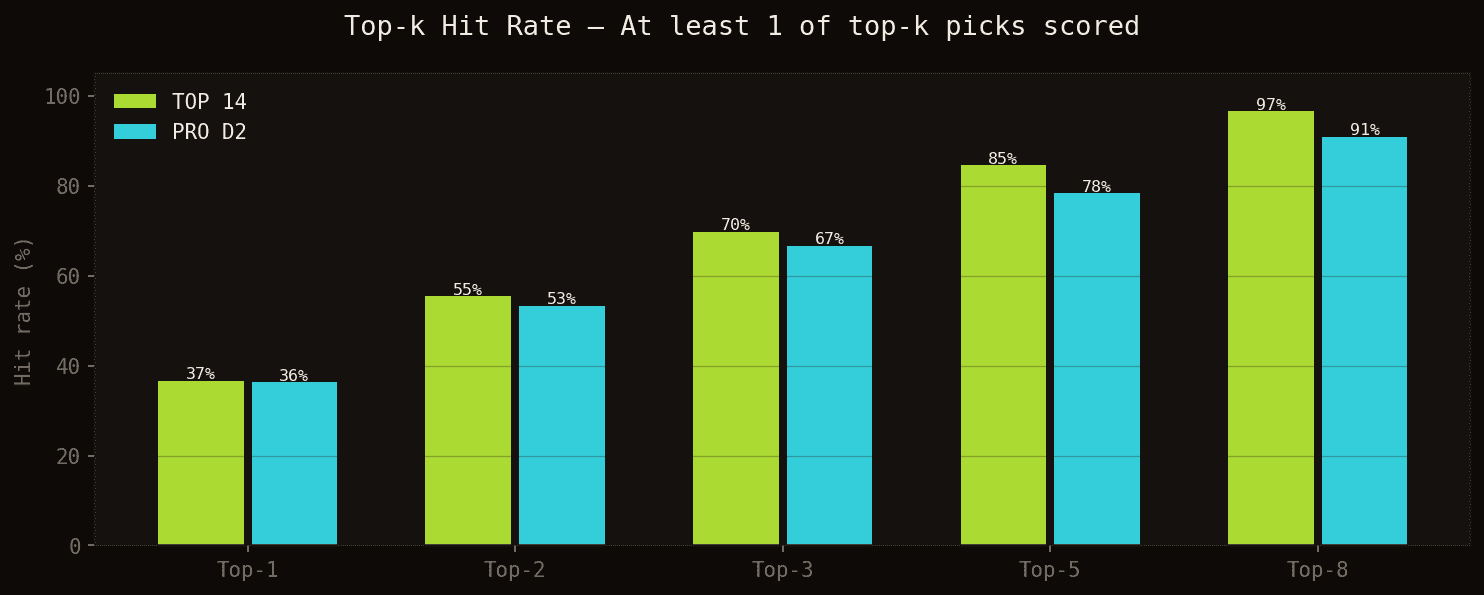
Choosing the top 3 picks, the model includes a real scorer in 70% of TOP 14 matches (67% in PRO D2). With 5 picks, that rises to 85% in TOP 14 and 78% in PRO D2.
Hit 5 performance — By selecting the 5 highest-ranked players across both teams, the model covers a real try scorer in 85% of TOP 14 matches and 78% of PRO D2 matches. That means only 1 in 6 matches (TOP 14) produces a try scorer outside the top 5 picks.
Scoring by position
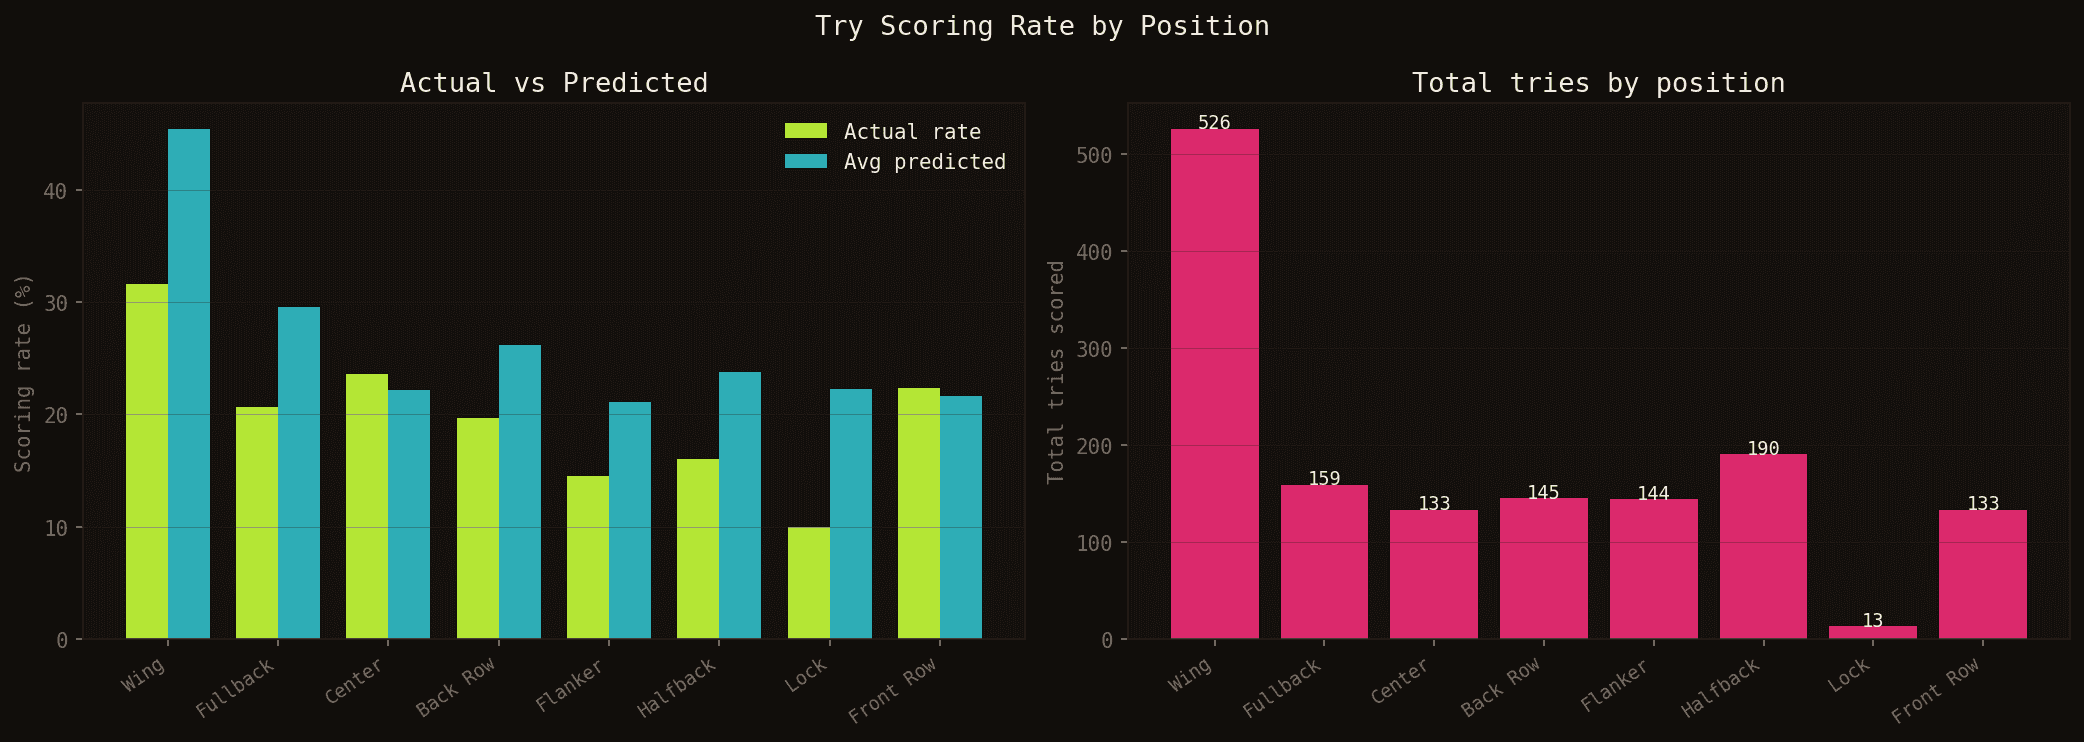
Actual vs predicted scoring rate by position (left) and total tries scored this season (right, TOP 14 + PRO D2 combined).
Wings and fullbacks dominate — expected. More interesting: the model systematically underestimates back rows and flankers relative to their actual scoring rate. These positions have a less predictable but real try-scoring profile — contact offensives, mauls that burst through, forwards appearing at the tail of a lineout. The model still has room to improve on these atypical profiles.
Most predictable teams
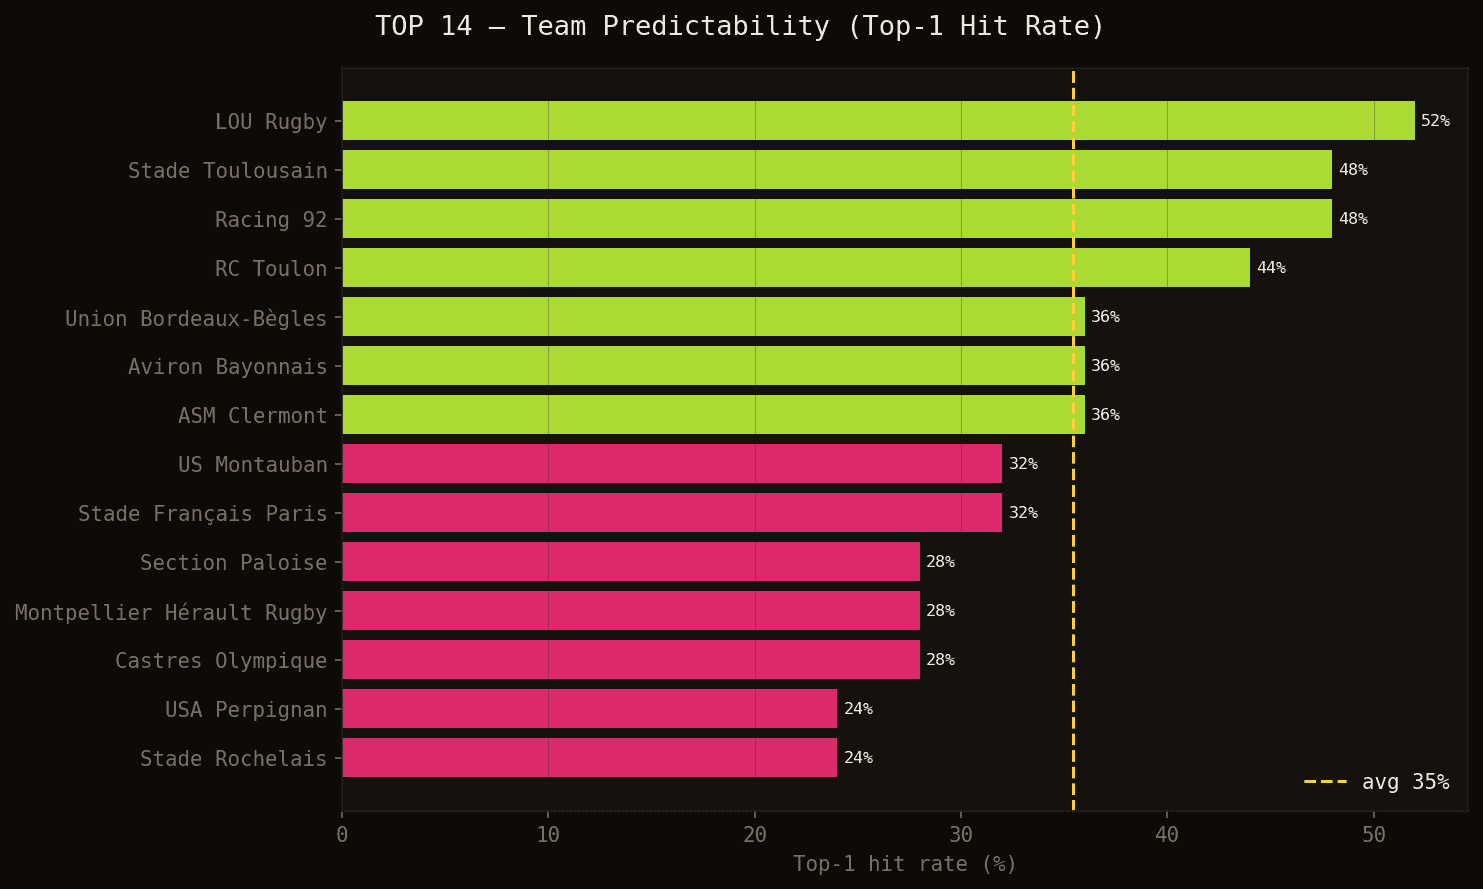
Top-1 hit rate by team in TOP 14 — in what percentage of matches did the model's top pick actually score?
LOU Rugby is the most predictable team (52%): the concentration of tries around Wainiqolo makes prediction relatively reliable. Racing 92 and Stade Toulousain are tied at 48% — but for opposite reasons. Racing has a few regularly-identified scorers, whereas Toulouse is the championship's most prolific team (72 tries across the season, 27 different scorers), which actually dilutes individual predictions. When literally anyone in the squad can score, pinpointing exactly who is harder.
At the other end, USA Perpignan and Stade Rochelais are the hardest to call (24%). Perpignan scores rarely (18 tries total); La Rochelle, despite 55 tries, spreads them across 17 different players.
Players who surprise the model
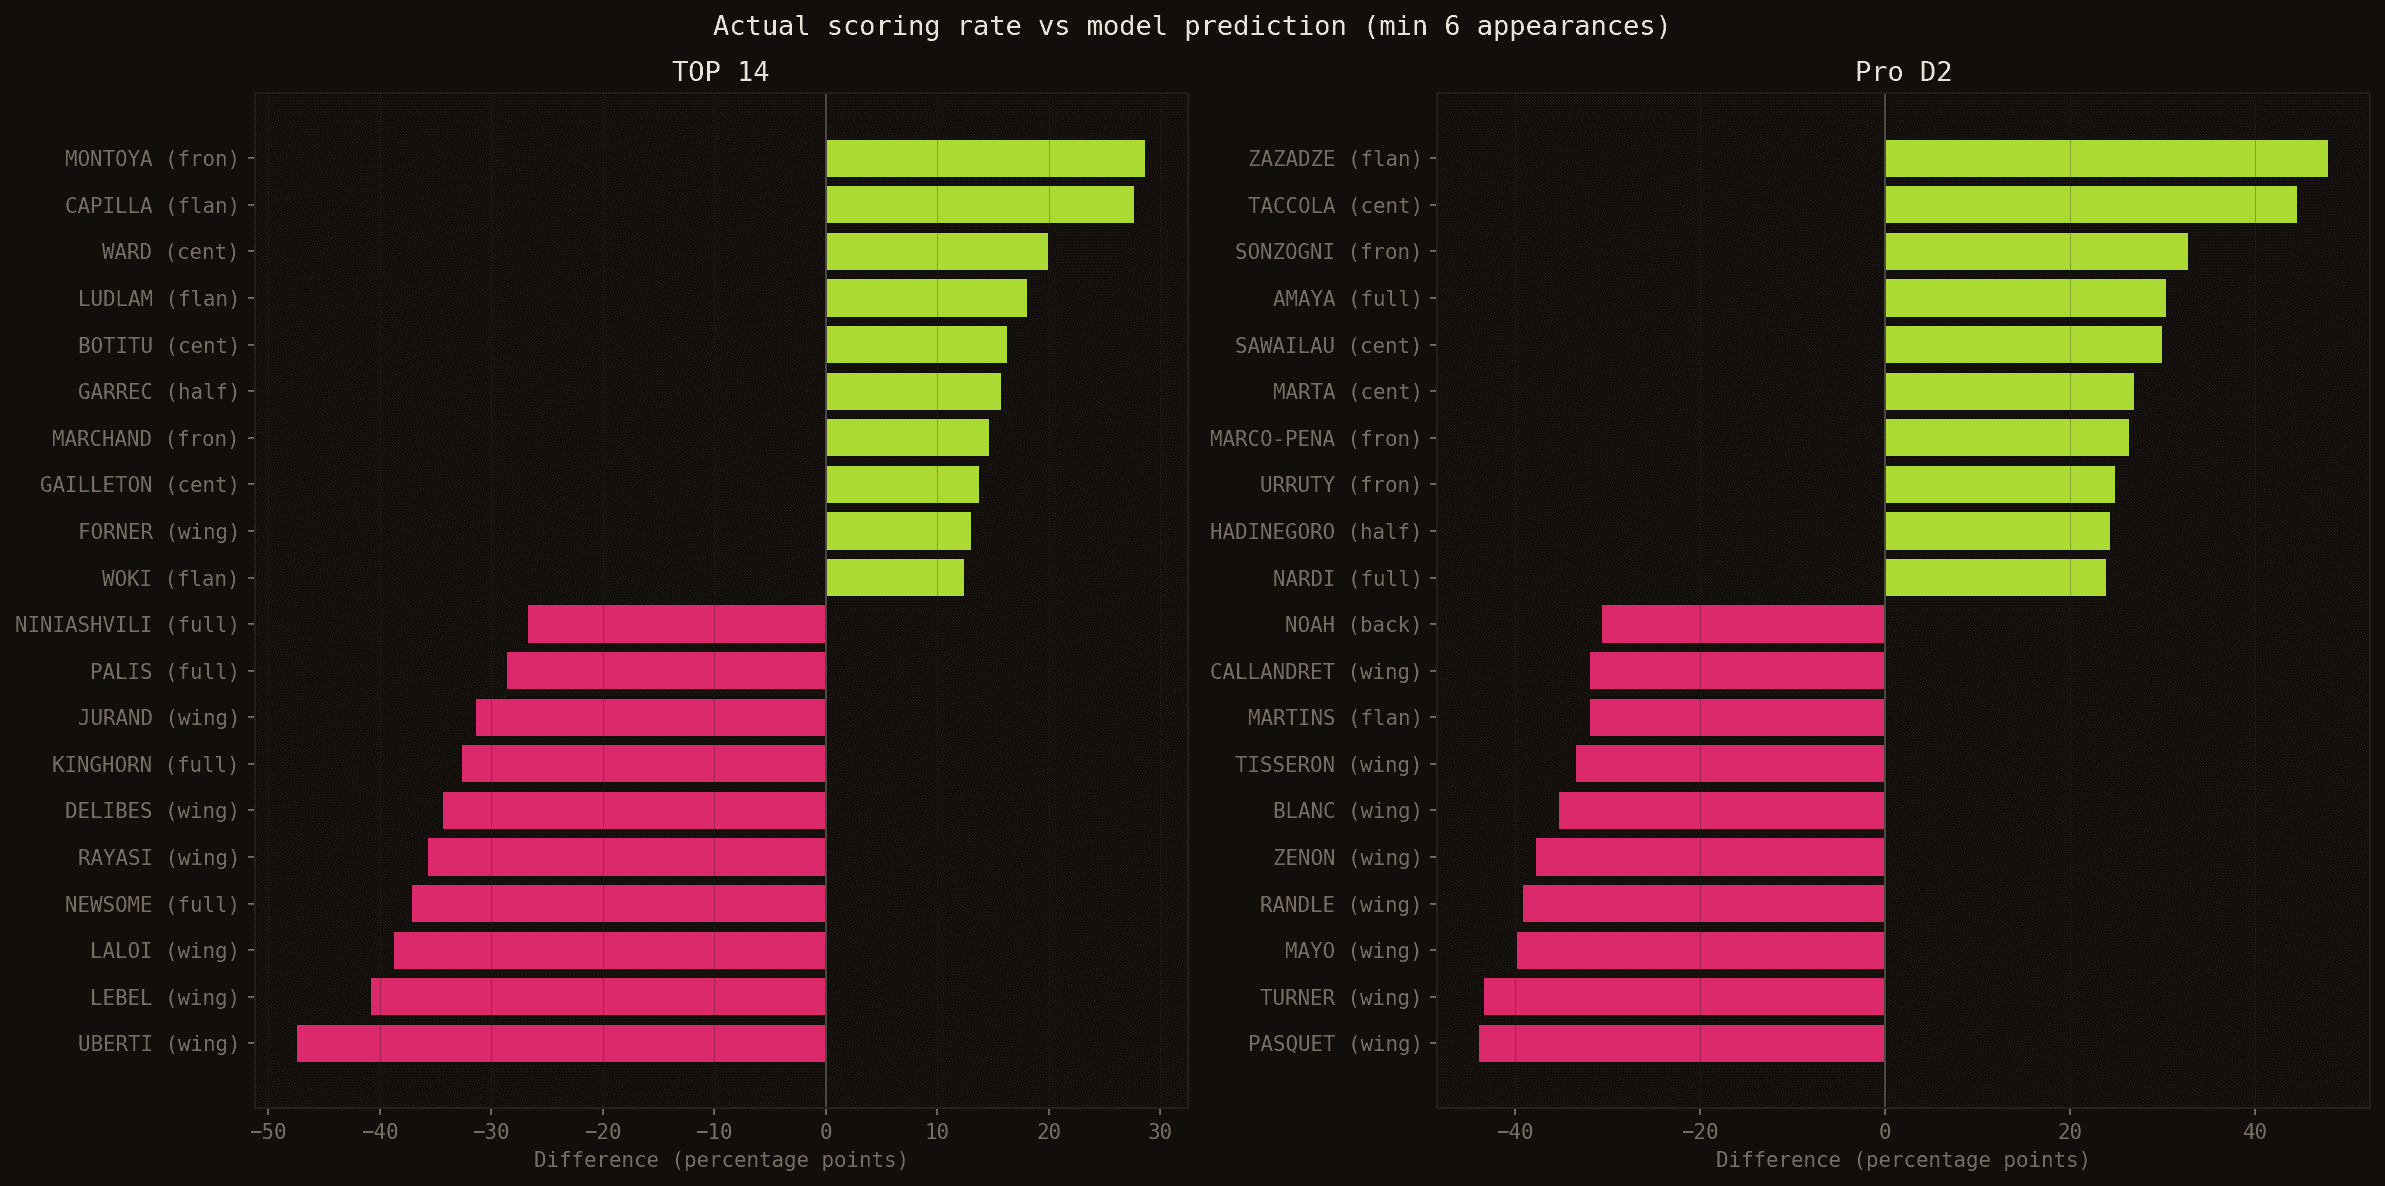
Gap between actual scoring rate and model prediction, by championship. Green: underestimated by the model. Red: overestimated.
Matthis LEBEL (Stade Toulousain) is the model's biggest miss in TOP 14: −41 percentage points below prediction. He scored in 5 of 17 predicted rounds (29%), against a model average of 70%. One of France's best wings, the model consistently rated him highly — but Toulouse spread their tries across the whole squad (27 different scorers this season). When anyone can score, even the top statistical pick underdelivers in terms of per-game consistency.
On the flip side, Juliàn MONTOYA (Section Paloise) outperformed his forecast by +29 percentage points (50% actual vs. 21% predicted). A hooker whose defensive profile doesn't attract the model's attention, but who showed up in the right place all season.
Gaël DREAN (Toulon), meanwhile, is a model success story: 71% actual vs. 65% predicted — almost perfect. The profile of a dominant wing in an effective attack, captured correctly.
Most consistent scorers
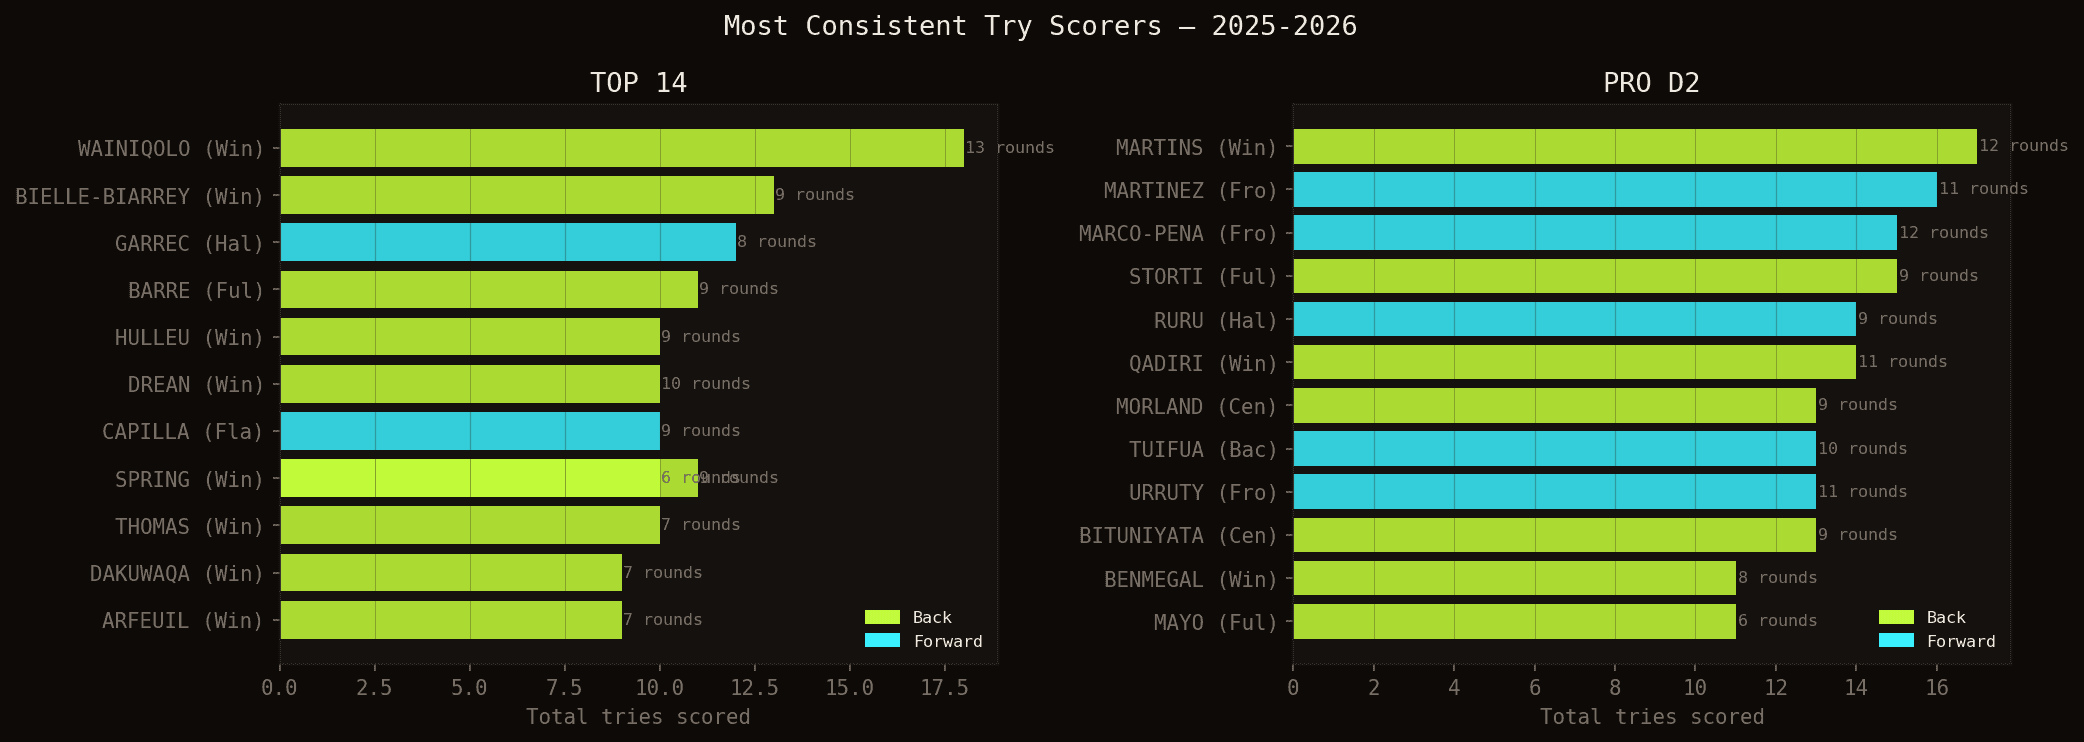
Players who scored in the most different rounds. Wainiqolo (18 tries, 13 rounds) is in a category of his own.
Jiuta Naqoli WAINIQOLO (18 tries in 25 rounds, 13 different matchdays) leads the rankings by a clear margin. Louis BIELLE-BIARREY (13 tries) is a strong second in TOP 14. Both have in common that the model ranks them #1 in the vast majority of their matches — confirming that their consistency is structural, not accidental.
Weather effect
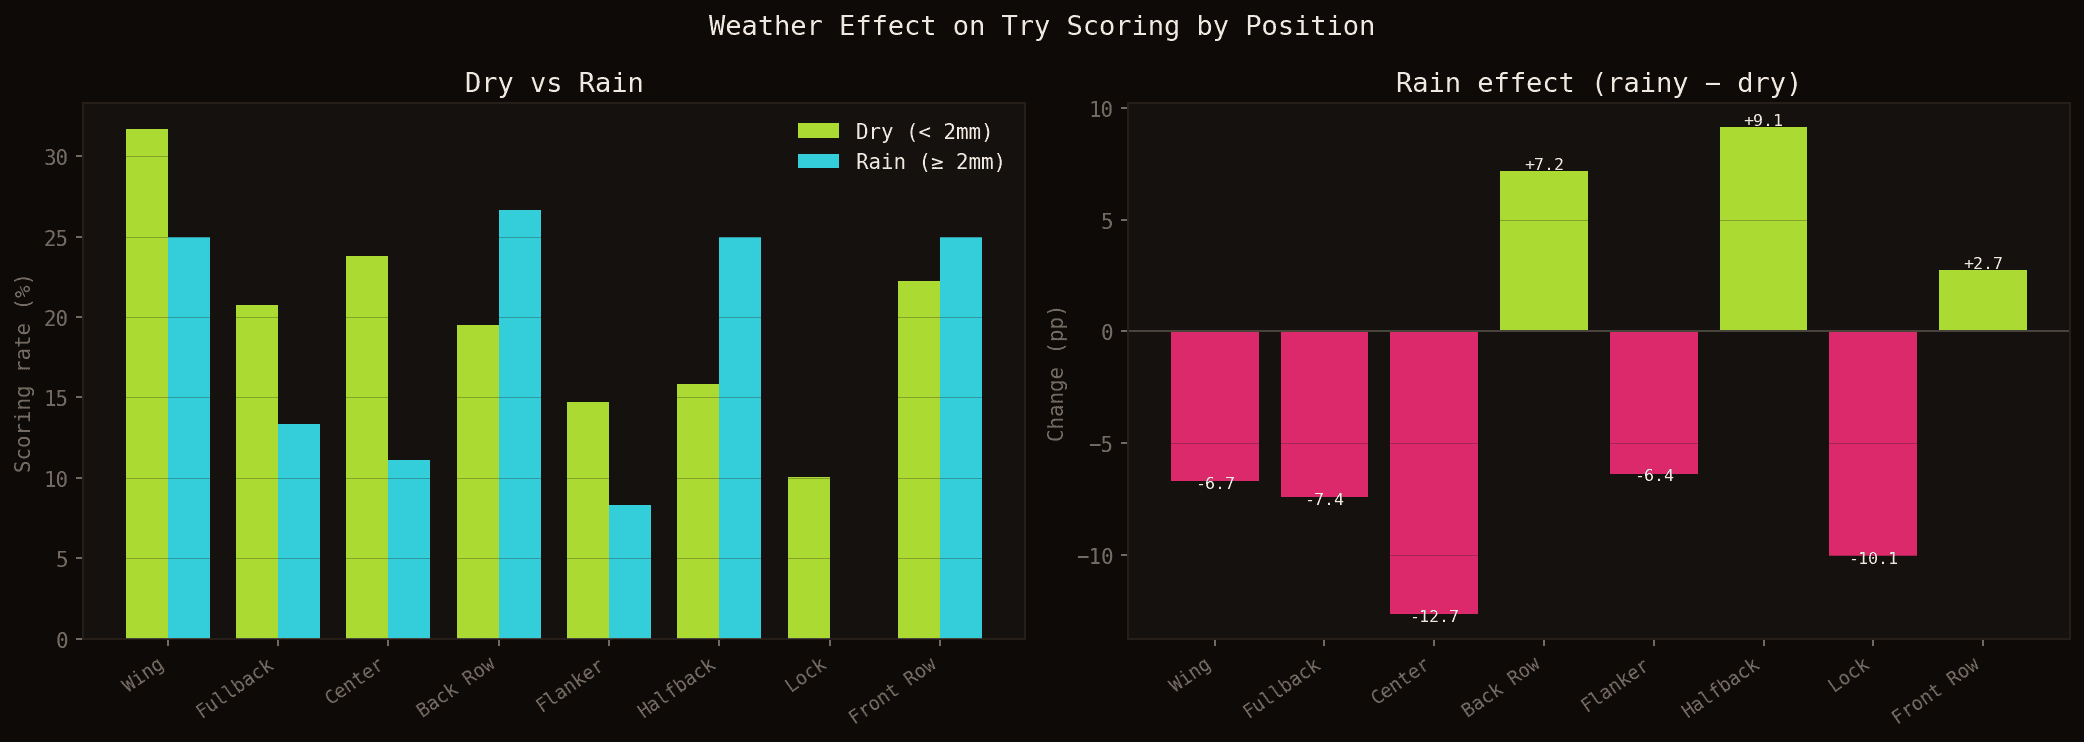
Impact of rain (≥ 2mm) on try-scoring rate by position. Combined TOP 14 + PRO D2, 2025-2026 season.
The analysis reveals a clear weather effect on which positions score tries. Centres are hit hardest, with a drop of -12.7 percentage points in the rain (23.8% dry → 11.1% wet). Fullbacks and wings also lose ground (-7.4pp and -6.7pp respectively). The logic is clear: rain reduces wide play, offloads and line breaks that benefit backline positions.
Conversely, halfbacks see their scoring rate rise significantly (+9.1pp, from 15.9% to 25.0%), alongside back rows (+7.2pp) and, to a lesser extent, front rows (+2.7pp). In wet conditions, the game becomes more direct, more physical, closer to scrums and rucks — you'd naturally expect front row forwards to benefit through picks-and-gos and dominant mauls. The data does show a positive trend for front rows in the rain, though the effect is more moderate than for halfbacks or back rows.
Worth noting: these figures are based on a limited number of rainy matches this season. The trend is consistent with the logic of the wet-weather game, but should be treated as directional rather than conclusive until confirmed across multiple seasons.
5. What the model doesn't know yet
Several interesting improvements remain to explore:
- Minutes played: a full 80-minute starter has different opportunities to an impact substitute
- Individual ELO: two wingers on the same team don't have the same skill level
- Weather as a training feature: the data is available and the results above show a real signal
- Current streak: does a player who has scored in the last 3 matches have a higher chance next week?
- Head-to-head records: some players perform very differently depending on the opposition
Conclusion
Predicting try scorers remains a challenge — rugby is unpredictable, which is what makes it great. But the data shows there is real, exploitable signal: players who score consistently tend to keep doing so, and attacking teams facing leaky defences structurally create more opportunities.
Predictions are updated each round on the Analytics page. If you want to see who the model picks for the next match, that's where to look 👈
If you have ideas for features to add or questions about the methodology, feel free to reach out!