What statistics actually win matches in TOP 14 and PRO D2?
Spoiler: it's not possession.
Whether you're an analyst, a coach, a fan or just someone who's yelled at their TV watching their team string together knock-on after knock-on, one question always comes back:
"What actually wins a rugby match?"

Christophe Urios: "There, I'm not going to use GPS — I'm going to feel the guys."
Is it territory? The scrum? The kicking game? Or is it, as some insist at the bar, "the referees — it's always the referees"?
In this article, we put the bar-room debates to rest. We pull out the data. Lots of data. Three seasons of TOP 14 and PRO D2 matches, dissected by multiple statistical models.
And you'll see… rugby has a few surprises in store.
🧠 Methodology: how I crunched the data
I selected 24 variables, each expressed as the difference between the two teams (tries scored, kicks in play, scrums won…). I then wanted to understand the link between these variables and the match result.
To do this I brought out the heavy modelling artillery — 7 complementary approaches (details for the curious):
1. Initial screening: correlation and mutual information
- Correlation: measures the linear relationship between each variable and the match result.
- Mutual Information: a non-linear measure of dependence between each variable and the result.
- Goal: quickly spot which variables seem most linked to winning before moving to more complex models.
2. L1-penalised logistic regression (Lasso)
- Goal: select the most relevant variables and quantify their effect.
- How it works: we model the win probability as a linear function of the variables (diff_tries, diff_penalties_scored, etc.) and add an L1 penalty that forces non-important coefficients to exactly zero.
- Advantage: produces an interpretable model where coefficients tell us whether a variable increases or reduces the win probability.
3. L2 logistic regression (Ridge)
- Goal: model win probability while keeping all variables.
- Feature: L2 penalty reduces variance and prevents overfitting.
- Output: interpretable coefficients showing whether a variable increases or reduces win probability.
3. Random Forest
- Goal: capture complex, non-linear relationships.
- How it works: a collection of decision trees is built, each on a random sample of matches and variables. Each tree "votes" for win or loss.
- Advantage: excellent at detecting interactions between variables — for example, the combined effect of a yellow card and low possession deep in the opposition half.
- Output: variable importance measured by average Gini impurity reduction.
4. Permutation Importance
- Goal: confirm variable importance on an already-trained model (Random Forest here).
- How it works: we randomly shuffle the values of one variable and measure the drop in performance.
- Advantage: a robust measure of actual influence on predictions.
5. Stability Ranking
- Goal: measure how consistently important variables are across multiple data samples.
- How it works: we train multiple Random Forests on cross-validated subsamples and average the importance ranks.
- Advantage: identifies variables that remain important regardless of the sample.
6. Gradient Boosting
- Goal: improve prediction by progressively correcting a weak model's errors.
- How it works: successive trees are built, each trying to correct the errors of the previous ones.
- Advantage: highly accurate and robust to noisy variables.
- Output: feature importance scores, often in agreement with Random Forest but more sensitive to subtle relationships.
7. SHAP analysis (SHapley Additive exPlanations)
- Goal: understand the influence of each variable on each individual prediction.
- How it works: for each match, SHAP distributes the "effect" of the prediction across all variables, inspired by game theory.
- Advantage: shows both global and local impact of a variable:
- Global: which variables explain wins on average?
- Local: for a specific match, why did a team win or lose?
Finally, I built a consensus score:
- Each method "votes" for its top variables.
- Variables selected most often across methods rise to the top of the ranking.
🏆 Results: the factors that most influence winning
After combining all methods, a clear ranking emerges. Here is the vote ranking:
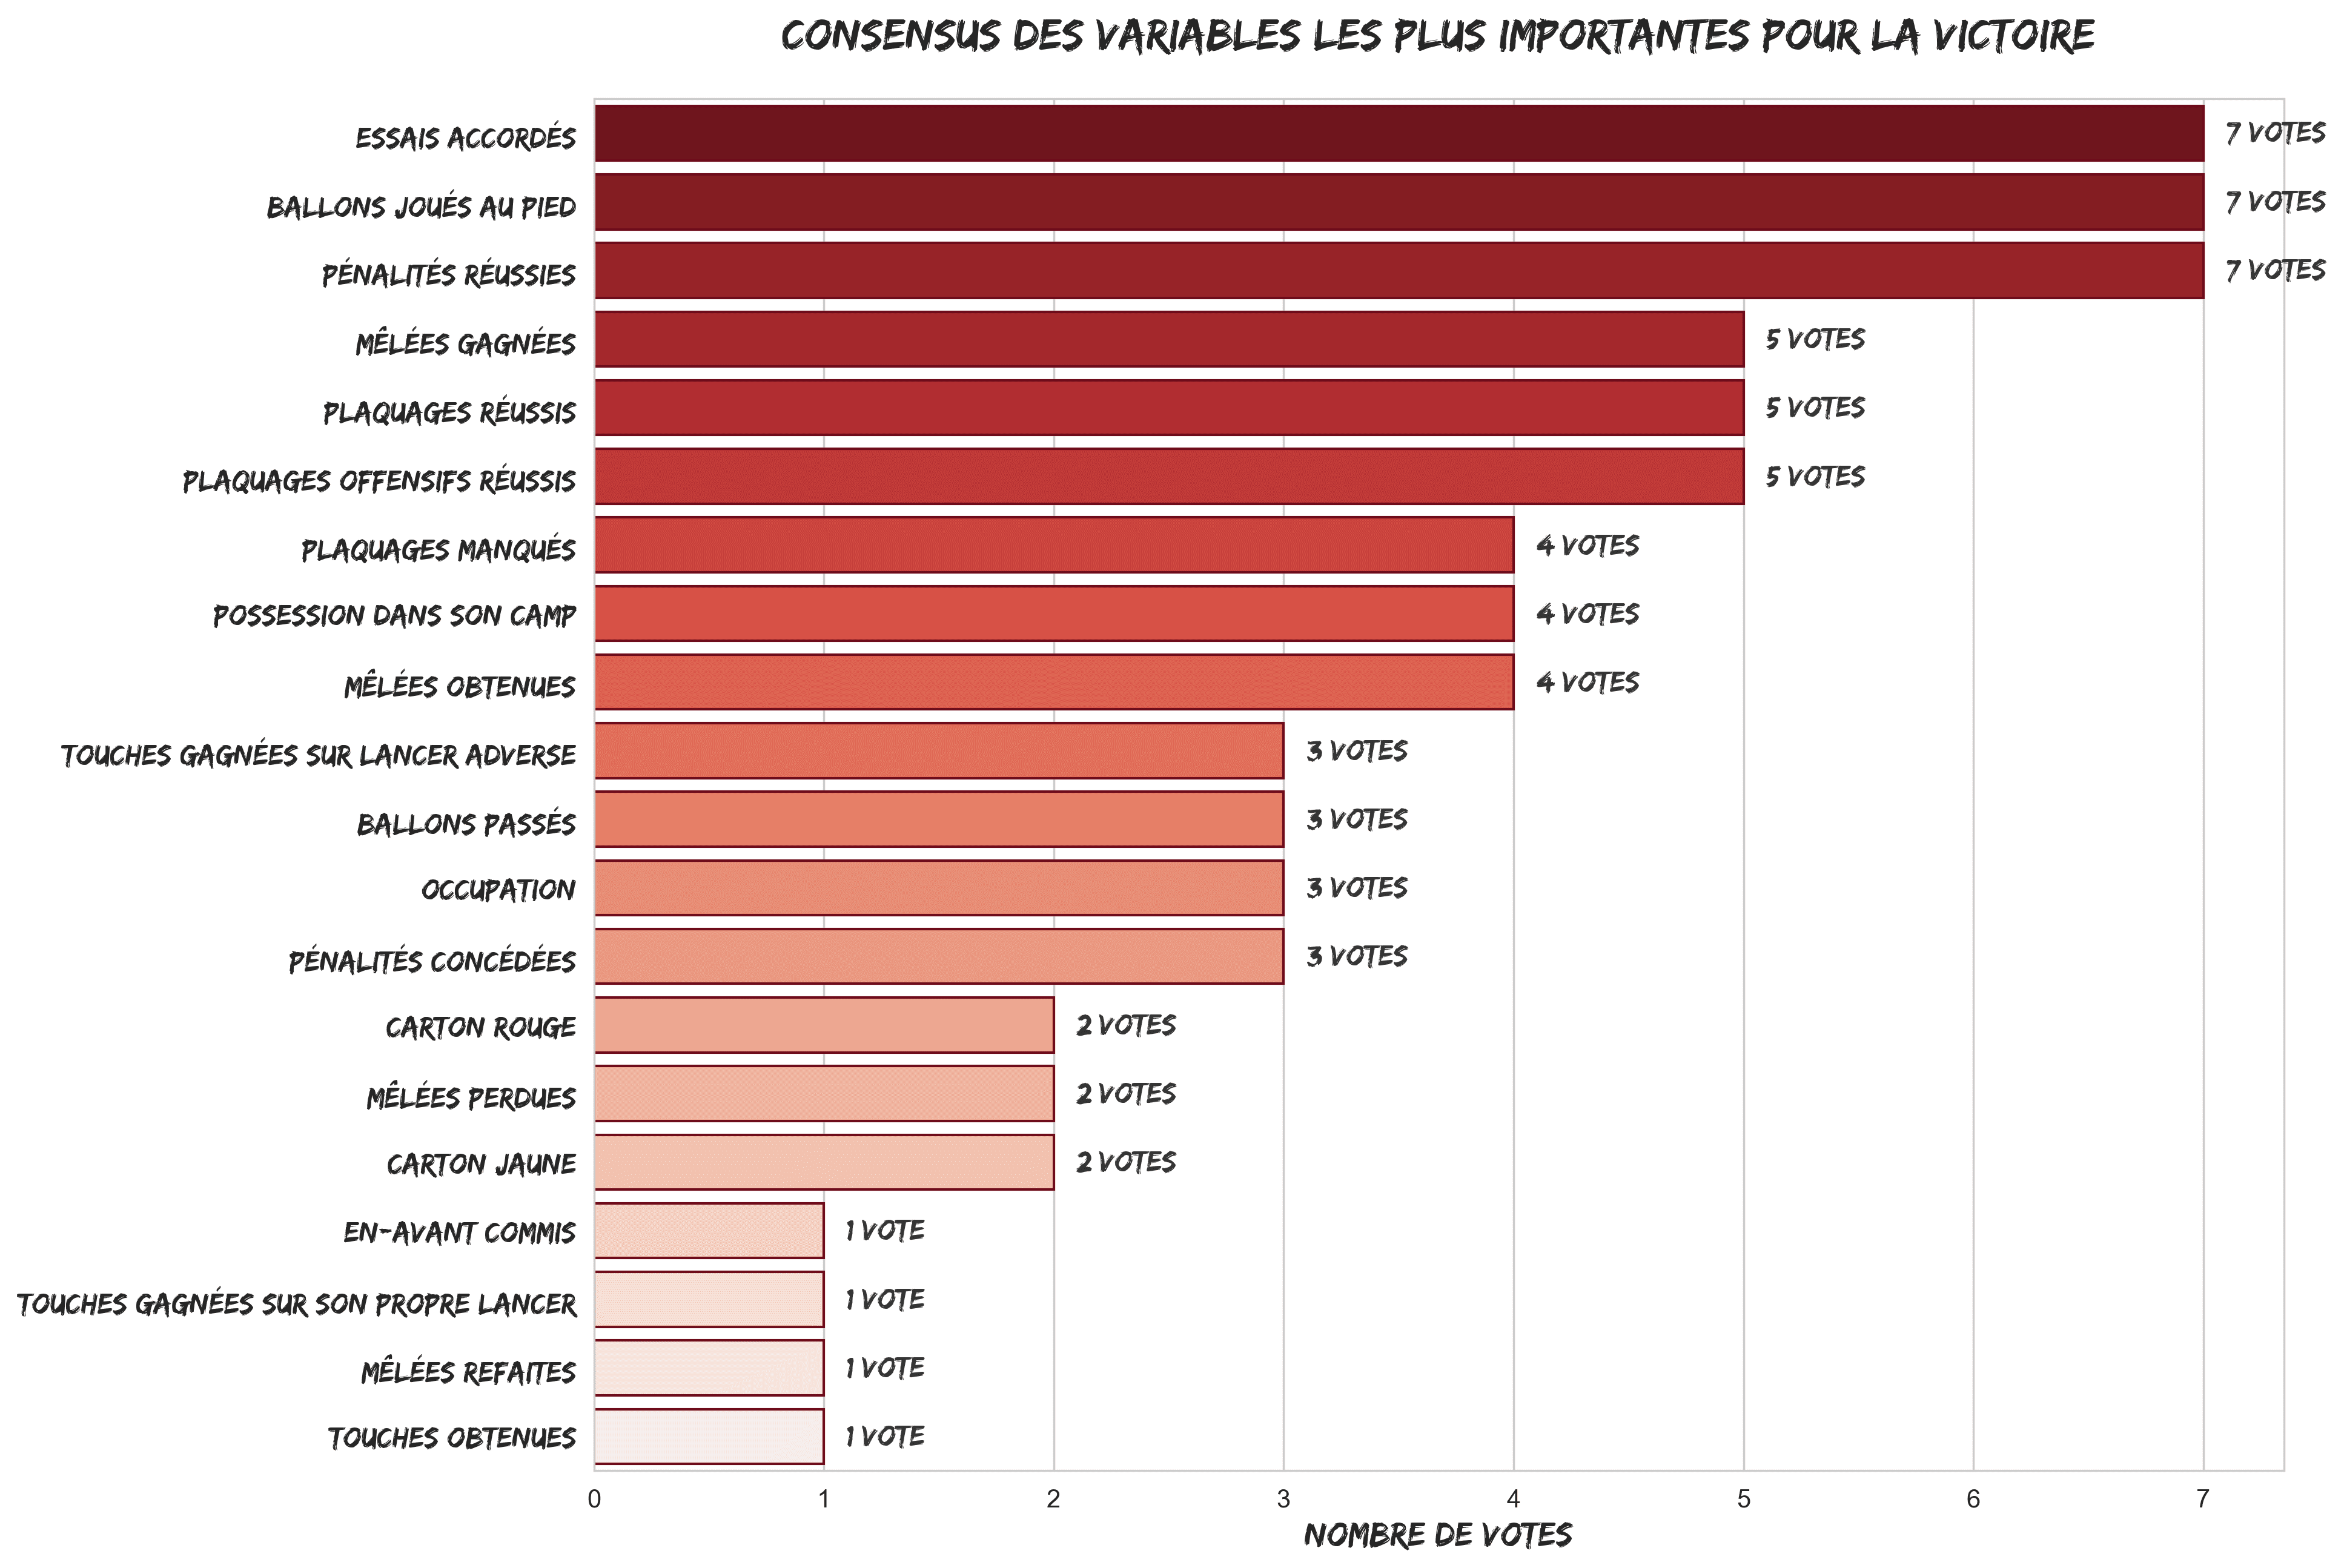
Variable ranking
🥇 1. Tries scored
No surprise — this is the queen variable. Thanks, Sherlock! The more tries you score, the better your chances of winning.
In the 2025–26 season, the TOP 14 team scoring the most tries per match is… Stade Toulousain, with 5.4 tries per game!
In PRO D2, RC Vannes leads at this level with an average of 5 tries per match.
🥈 2. Penalties scored
Obvious too… Yes, penalties score points and therefore increase win probability.
In TOP 14, Aviron Bayonnais leads this ranking with an average of 2.05 penalties scored per match in 2025–26.
In PRO D2, it's Valence Romans, with 2.6 penalties per match on average.
🥉 3. Kicking game: kicks in play
This is where it gets interesting! Teams that use their kicking game win more often. It's a tactical marker: territory, pressure, forcing errors.
In 2025–26, the TOP 14 team using the kick most (28 per match on average) is… Montpellier! In PRO D2, it's Oyonnax leading (30 kicks per match on average).
4. Scrums won
The forward pack plays a crucial role in winning matches. Teams that dominate at scrum time have a significant strategic advantage.
In 2025–26, the TOP 14 team winning the most scrums (43% per match on average) is… RC Toulon!
In PRO D2, again Oyonnax leads (30% per match on average).
5. Successful tackles
An effective defence is also a key winning factor.
The biggest tackler in TOP 14 in 2025–26 is Esteban Abadie. In PRO D2, it's Dax's Arnaud Aletti, with 106 successful tackles in total.
📊 Conclusion: the keys to winning.
As we close this article, we can settle at least one bar-room debate: no, winning does not come down to possession — and no (sorry), it's not just the referees either.
And as Christophe Urios might say, you could be tempted to "feel the guys"… but the data tells a different story.
Because at its core, modern rugby loves to prove us wrong. Keeping the ball, chaining phases, making the stadium roar… it's beautiful. But it doesn't always win matches.
What wins matches, more often than we think, is that well-struck diagonal kick, clean territory play, the moment you accept giving the ball back… to take control again 40 metres further on, with just a little more pressure.
In short, winning at rugby isn't necessarily about playing more. It's about playing smarter.
So next time you see your team kick the ball, wait a moment before complaining — there might already be, in that kick, a small piece of the victory.