Expected Try (xT): putting a number on danger
In football, Expected Goals (xG) has become ubiquitous: every shot is assigned a probability of becoming a goal, based on position, angle, and action type. A shot from the penalty spot is worth ~0.76 xG. A header from a corner is worth ~0.05.
Rugby. Same problem, same question: how dangerous is this action for the defending team? A ruck at halfway is not the same as a linebreak 5 metres from the try line. A well-won lineout in the opposition 22 is not worth the same as a turnover after a wayward kick.
Expected Try (xT) answers that: what is the probability that the team in possession scores a try in the next 60 seconds, from this position, following this action?
The data: 48 matches from the 2023 Rugby World Cup, with GPS position data for every action — 32,000+ events and 325 tries.
1. The geography of danger
The first thing the analysis reveals is a stark gap between where play happens on the pitch and how dangerous each zone actually is.
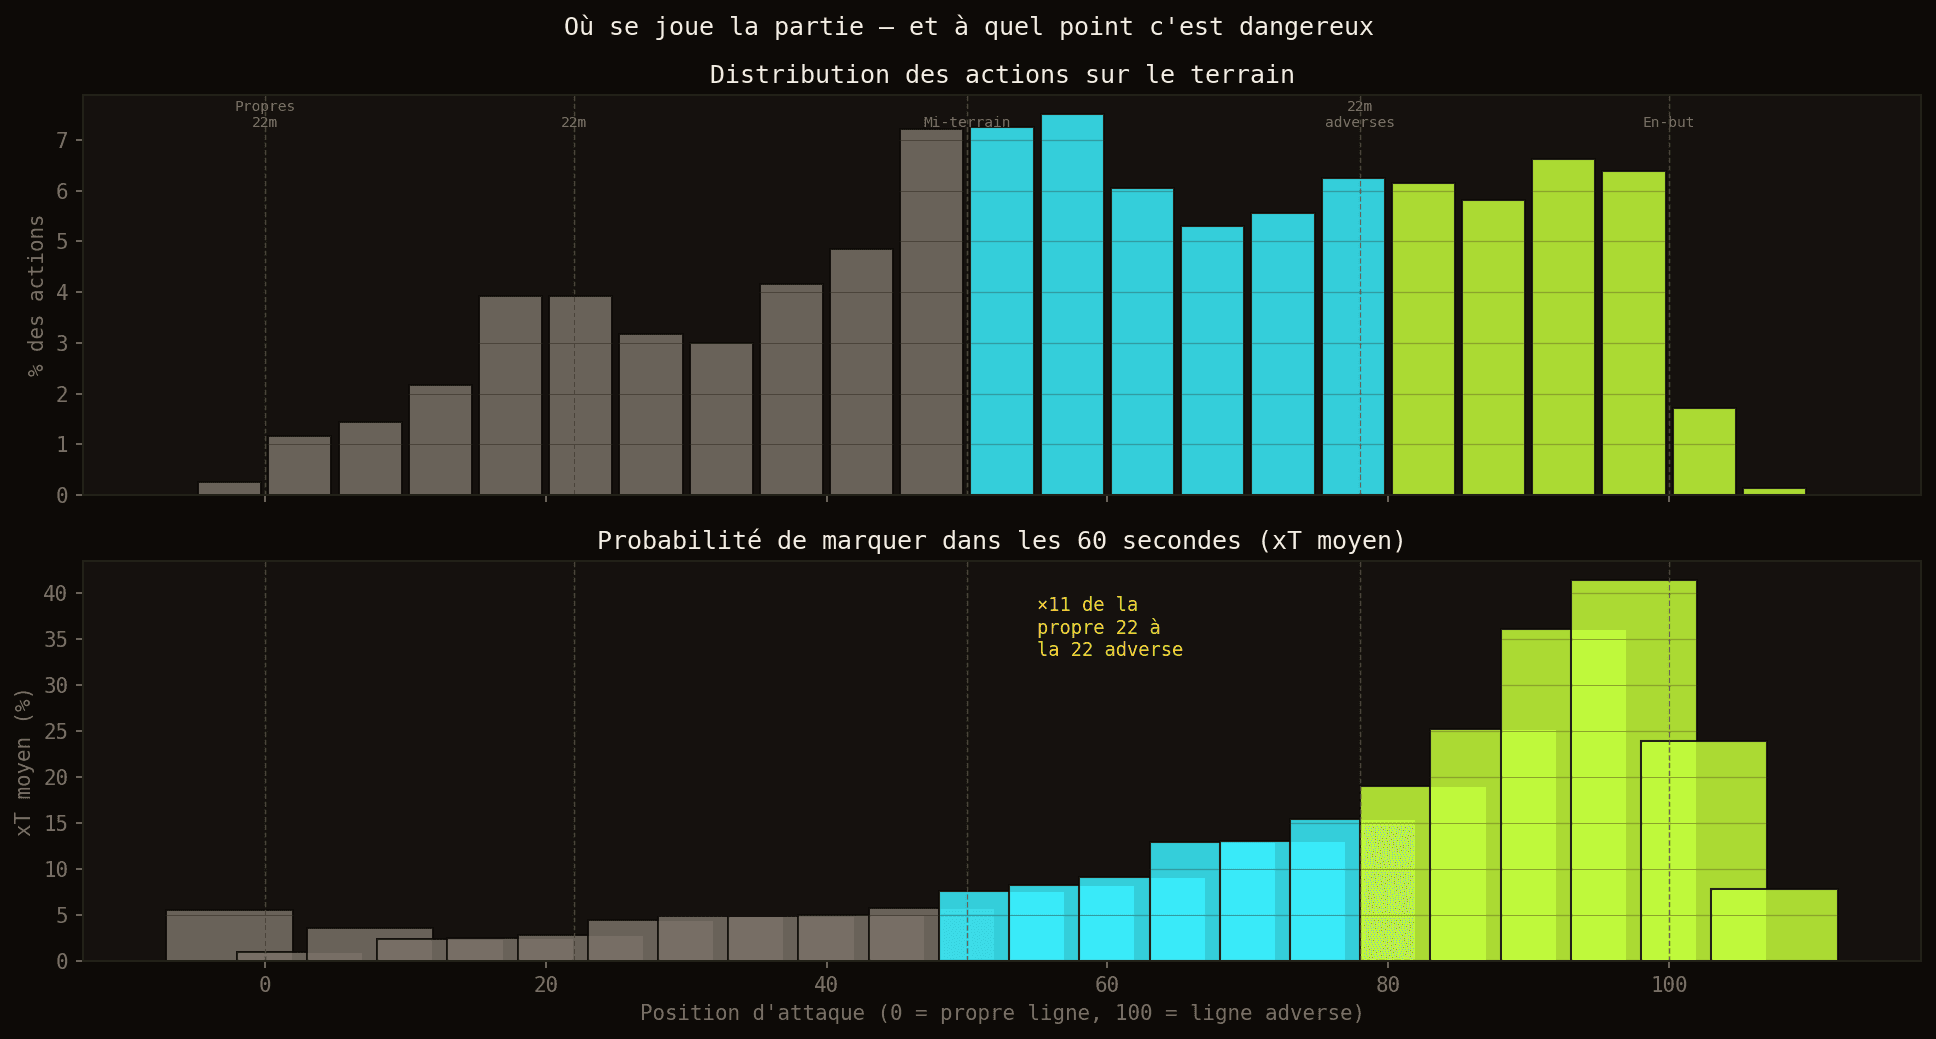
Top: distribution of all actions on the pitch. Bottom: average xT (probability of a try in 60s) by zone. The gradient is dramatic.
Half of all actions happen between the two 22-metre lines. That's where most rucks, scrums, and lineouts take place. And yet, xT in that zone is near zero — between 3% and 5%. Having territory does not mean being dangerous.
The probability of scoring in the next 60 seconds rises from 2.7% in the own 22 to 29.7% in the opposition 22 — an 11× increase. That gradient is the entire justification for the model.
2. The coordinate system
The GPS data uses a convention where x runs from 0 to 100 (own try line → opposition try line). Problem: at half-time, teams switch ends. An x = 80 in the first half doesn't mean the same thing as in the second.
For each match and each half, we infer each team's direction of attack from the positions of tries scored. Every event is then converted to attack_x: 0 = own try line, 100 = opposition try line. The attacking team always plays left to right in this frame.
3. The label definition
The label is binary: does the team in possession score a try within 60 seconds of this event?
Why 60 seconds? It captures the immediate threat without conflating long possession phases. Across 32,123 events, 13.4% are positive — a realistic imbalance, far from a coin flip.
Possession is inferred from action type:
- Tackle → the tackling team is defending, so the other team has possession
- Turnover → the team that wins the ball has possession
- All others → the acting team has possession
Cross-validation uses GroupKFold by match — no event from a test match appears in training. Without this, the model memorises matches instead of learning the game.
4. Exploratory analysis
xT by zone and action type
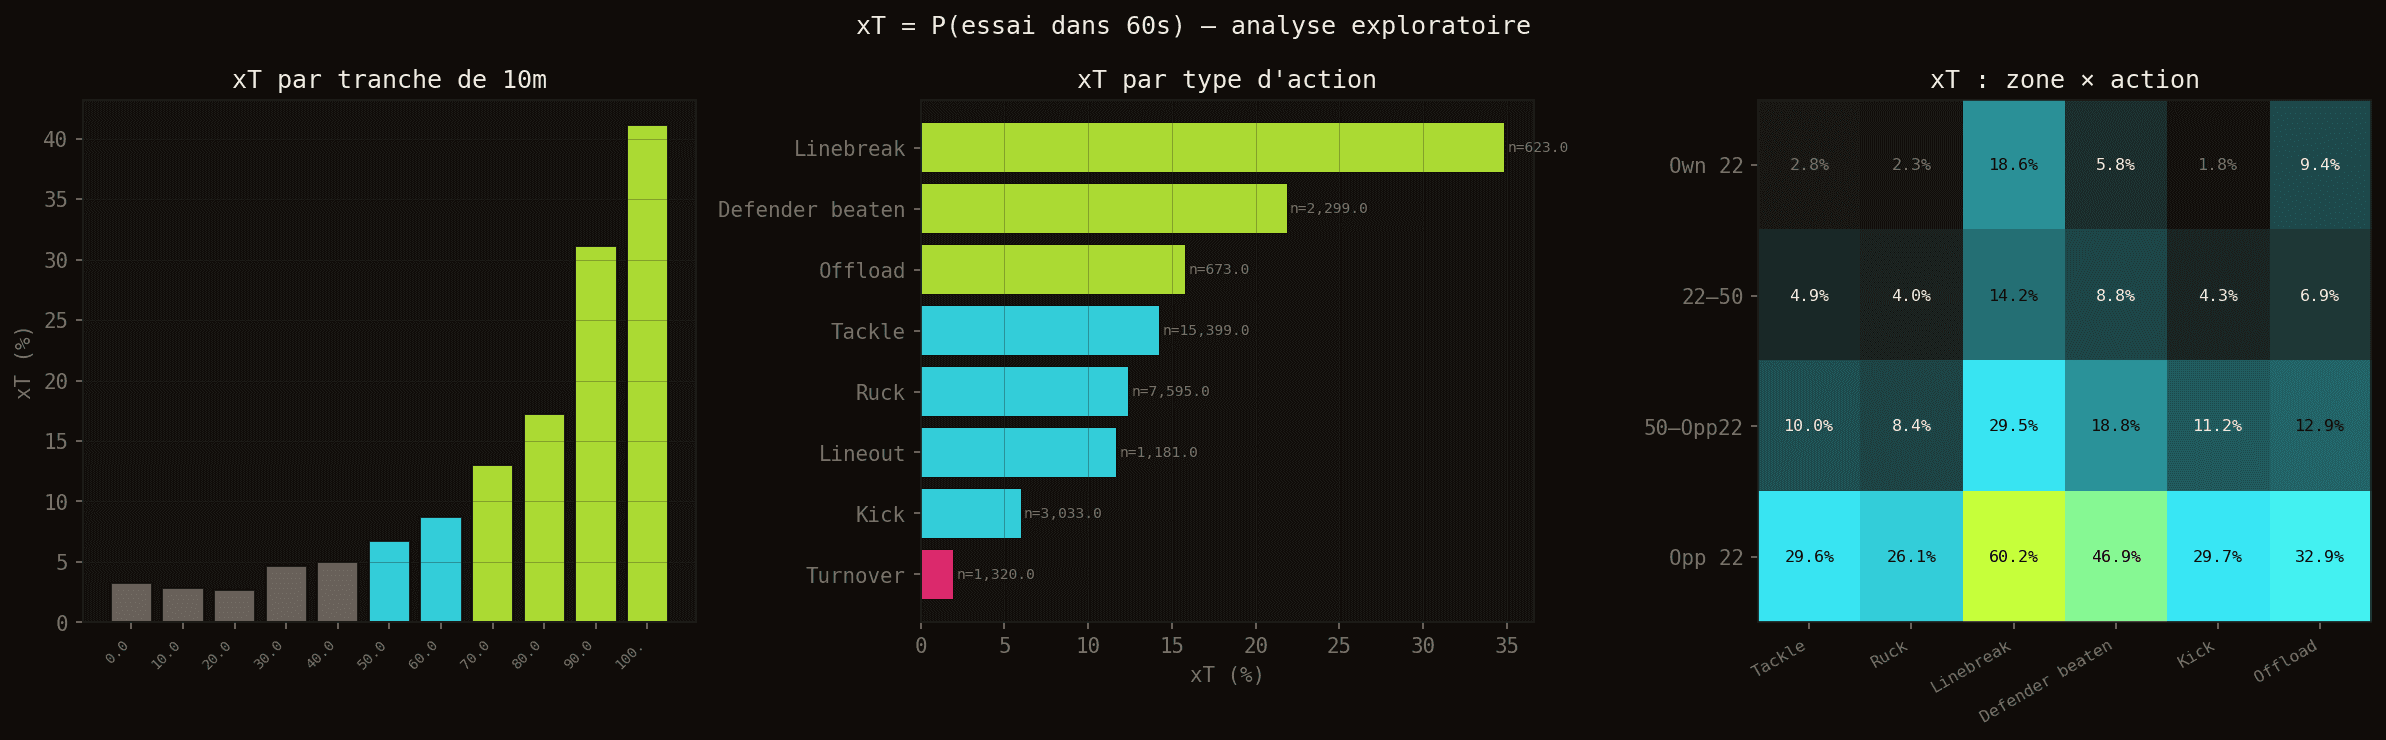
Left to right: average xT by 10m strip, by action type, and the zone × action matrix.
By action type, the hierarchy is unambiguous. A linebreak is worth 16% probability of a try in the next minute — 2.5× more than a standard ruck (6%). A turnover collapses to 0.6%: losing the ball almost instantly cancels any threat.
The zone × action matrix (right) reveals an important leverage effect: in the opposition 22, even a simple ruck exceeds 20% xT. Position amplifies the value of every action.
Context effects
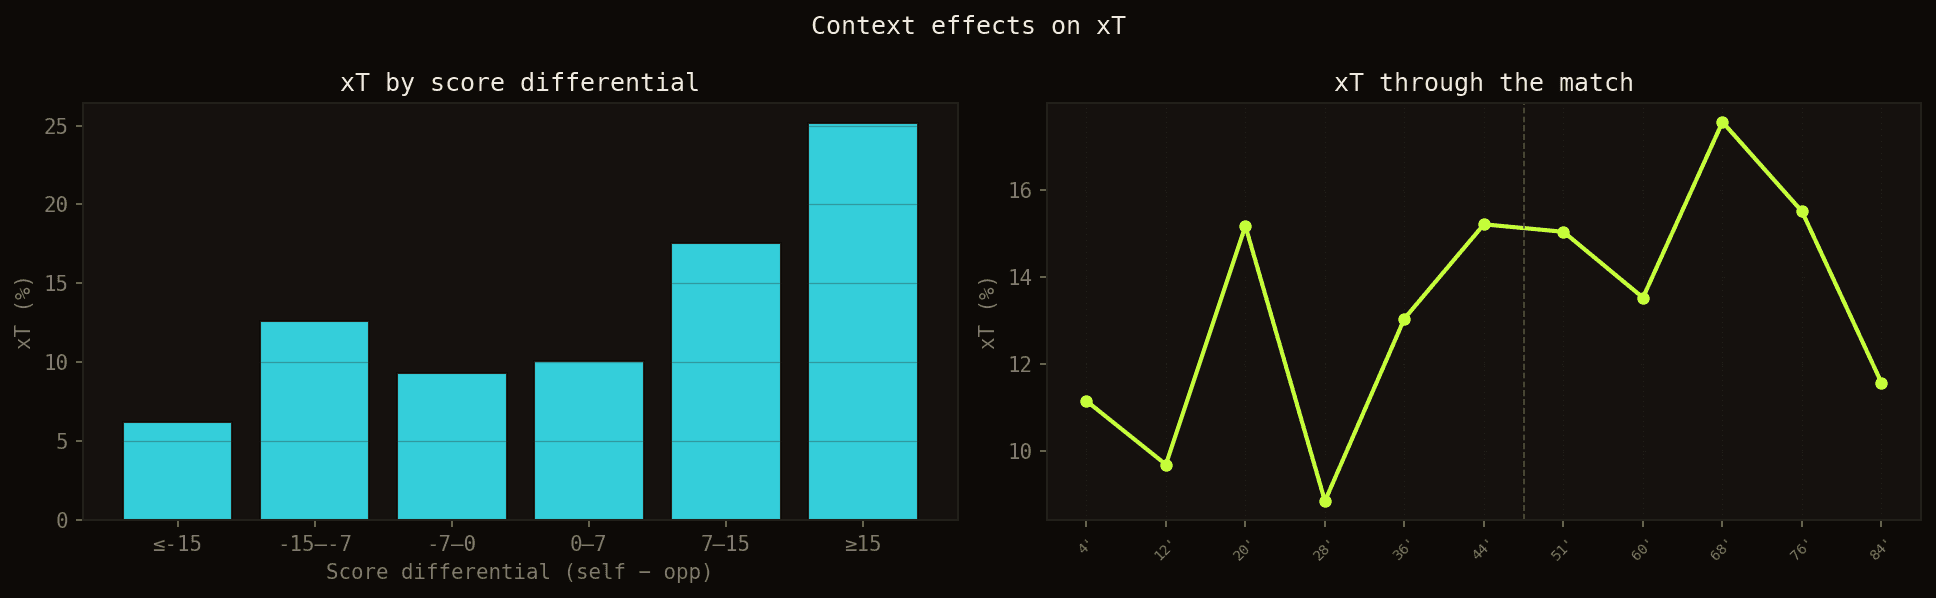
Left: xT by score differential. Right: xT evolution through the match.
Score differential has a modest effect. A team leading or trailing by less than 7 points maintains a similar xT. Large leads slightly reduce offensive intensity — teams manage the game.
Danger increases late in the match. xT rises clearly in the final 20 minutes: teams take more risks, defences tire, gaps open up.
5. The model
Features
9 input variables: longitudinal position (attack_x), distance from pitch centre (y_center), distance to the opposition line (dist_line), zone flags (in_opp_22, in_opp_half), score differential, match progression, half indicator, and action type.
Leak-free validation
GroupKFold(5 folds) by match ID. Cross-validation results:
- Logistic Regression: AUC 0.788 ± 0.033
- XGBoost: AUC 0.768 ± 0.022
Logistic regression marginally outperforms XGBoost — the position gradient is linear enough that simplicity is an advantage.
Test set evaluation
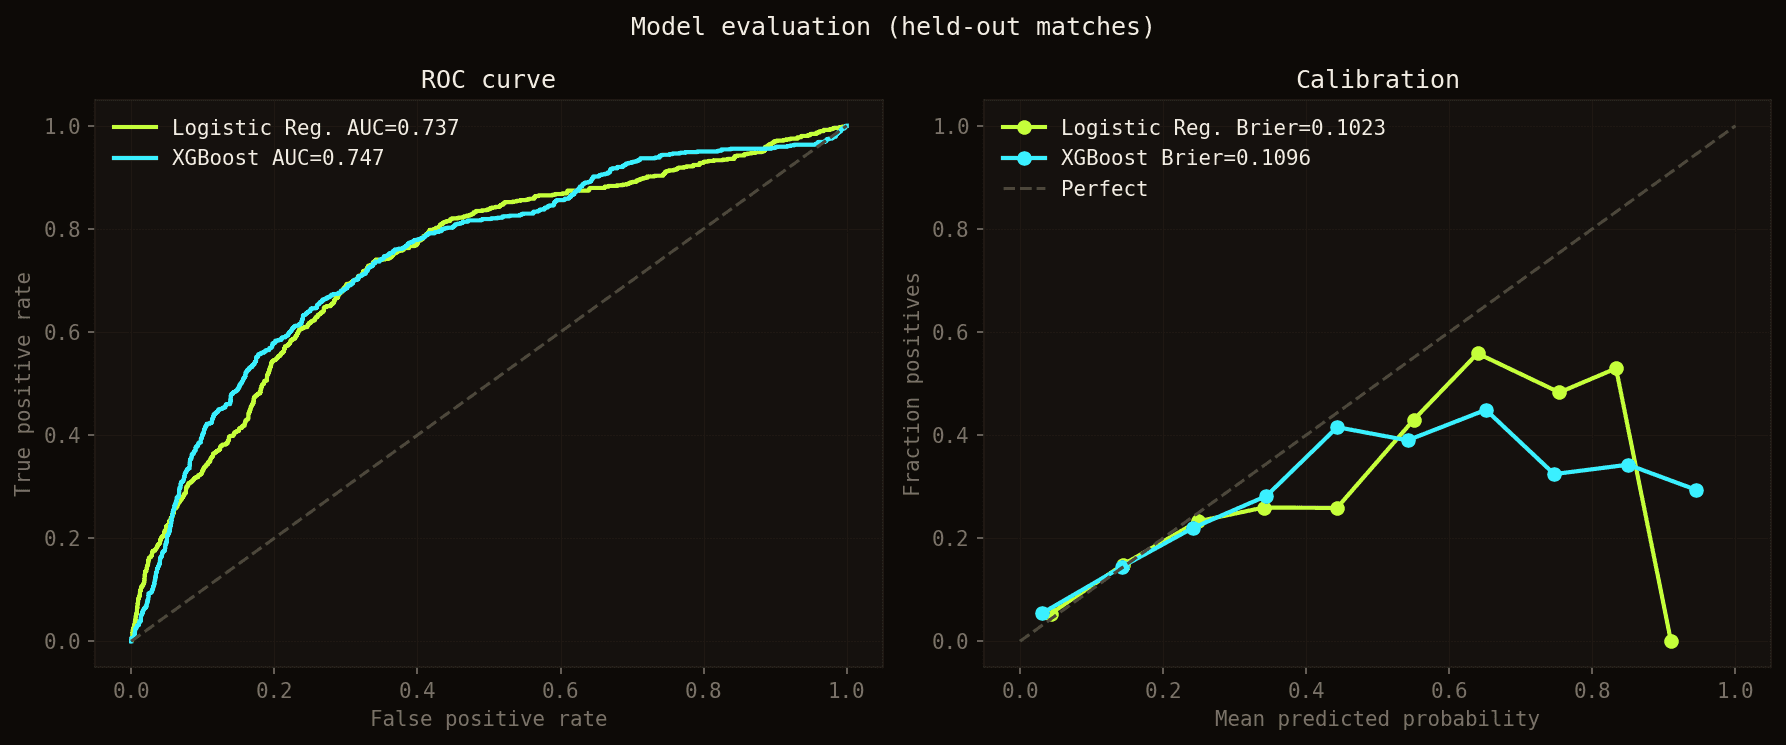
ROC curves (left) and calibration (right) on the 20% of matches held out for testing.
Calibration is solid. An event predicted at 20% does translate to a try in approximately 20% of cases — no systematic over- or under-estimation.
Feature importance
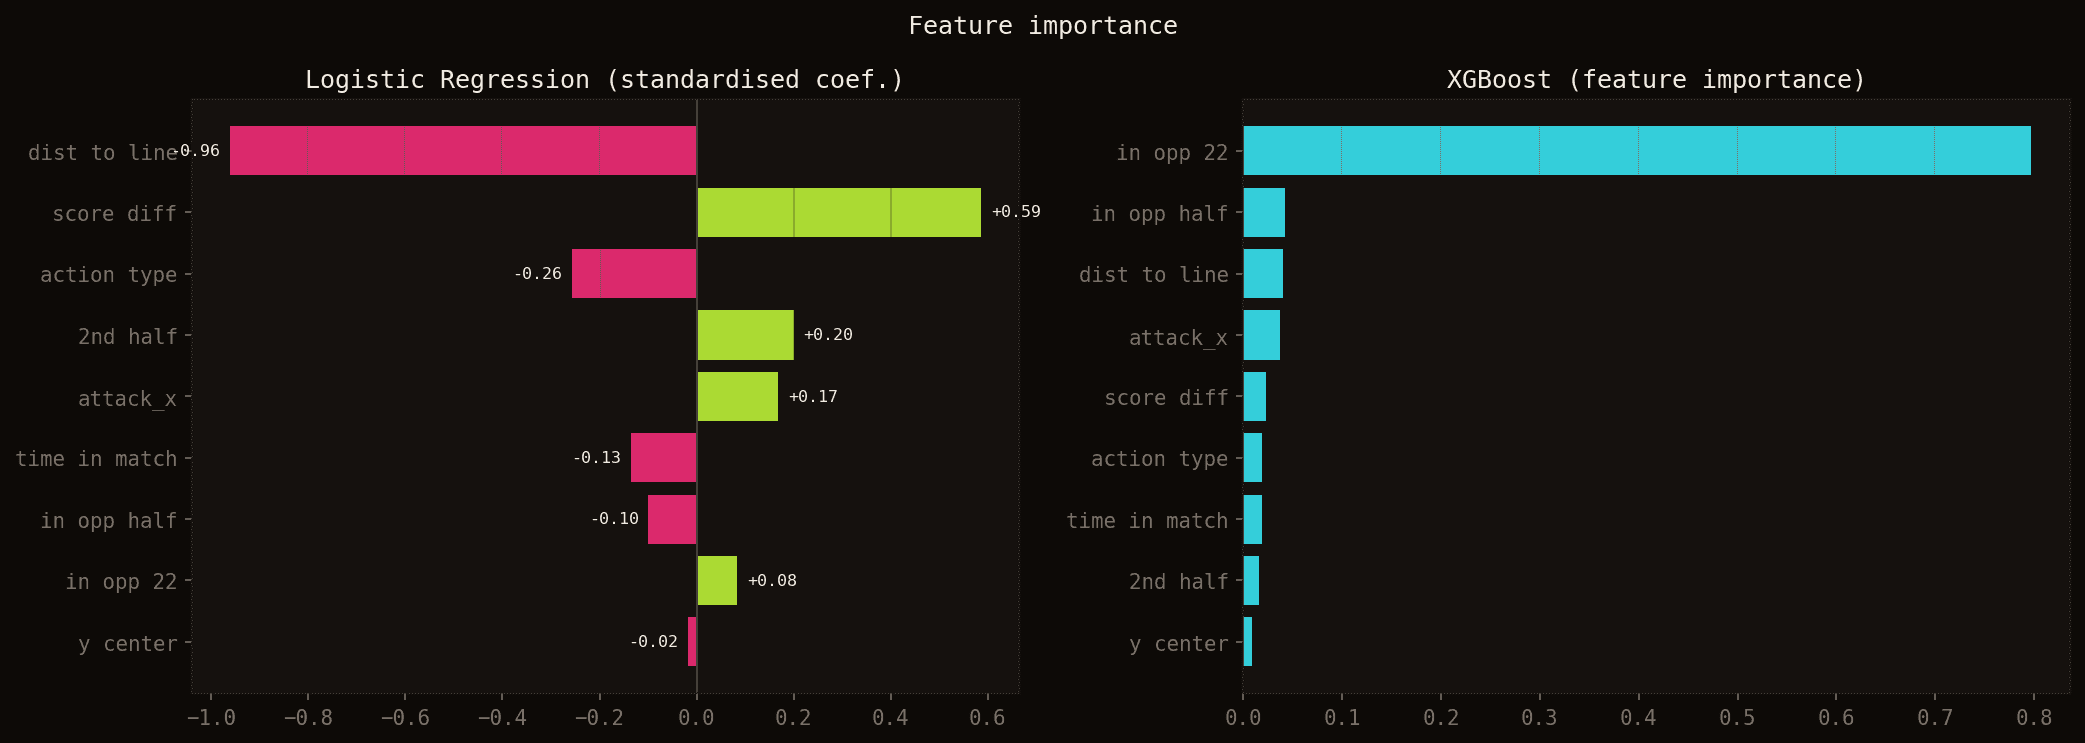
Standardised logistic regression coefficients (left) and XGBoost feature importance (right).
The two models tell the same story in different ways.
In logistic regression, dist_to_line (distance to the opposition try line) dominates with a coefficient of −0.96 — negative because shorter distance means more danger. attack_x appears much weaker (+0.17), not because it is less important, but because dist_to_line = 100 − attack_x: the two variables are perfectly correlated, and the LR splits the same signal across both. Collectively, the four position variables (dist_to_line, attack_x, in_opp_22, in_opp_half) all capture the same physical information: where the team is on the pitch.
score_diff ranks second (+0.58). This reflects a genuine signal — teams in the lead often attack a tired or disorganised defence — but it is also partly an artefact of blowout matches (South Africa vs Romania, for example), where the lead explodes at the same time as tries flow freely.
In XGBoost, a single variable dominates at 80% importance: in_opp_22. The model found crossing the opposition 22-metre line as the decisive threshold. Beyond it, danger spikes; before it, it stays contained.
Both models converge on the same conclusion: position is the dominant factor, and entering the opposition 22 is the boundary that changes everything.
6. The danger map
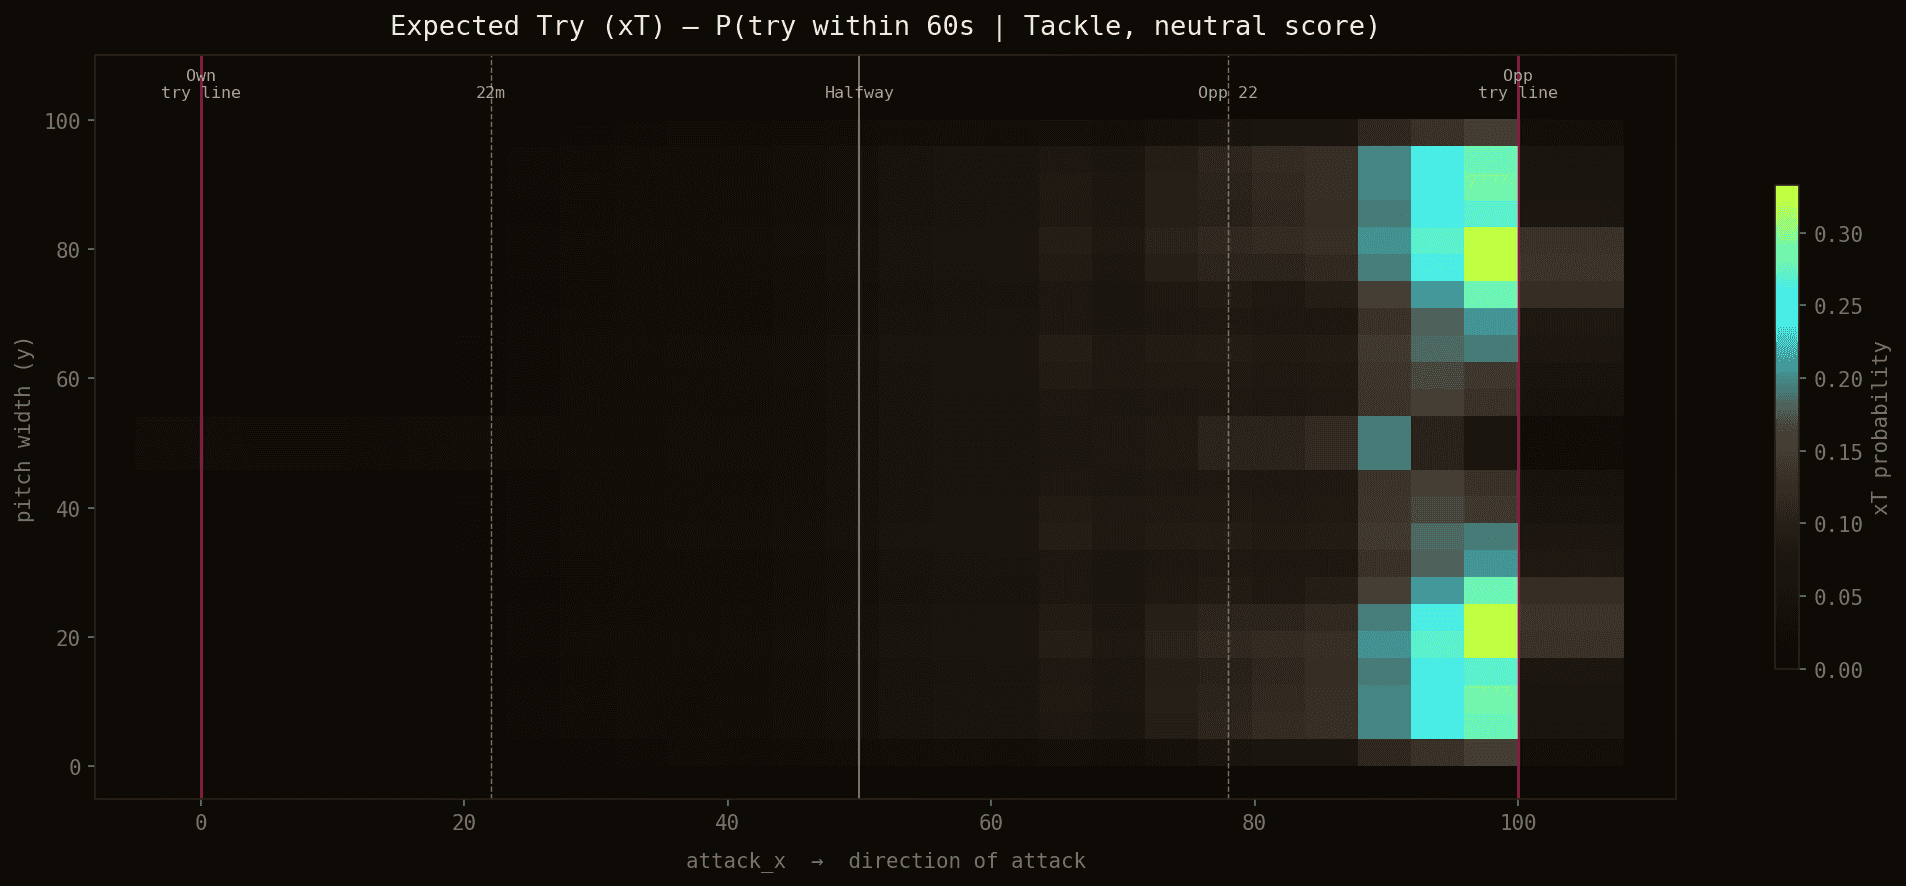
xT = P(try in 60s) for a standard ruck, neutral score, mid-match.
The probability starts near zero at the own try line, rises progressively to halfway, accelerates in the opposition half, and explodes in the opposition 22 to reach 20–35% depending on lateral position.
One notable detail: the centre of the pitch is slightly more dangerous than the wings at the same longitudinal position. Central actions preserve attacking options in both directions.
7. The value of actions
xT by action type along the pitch
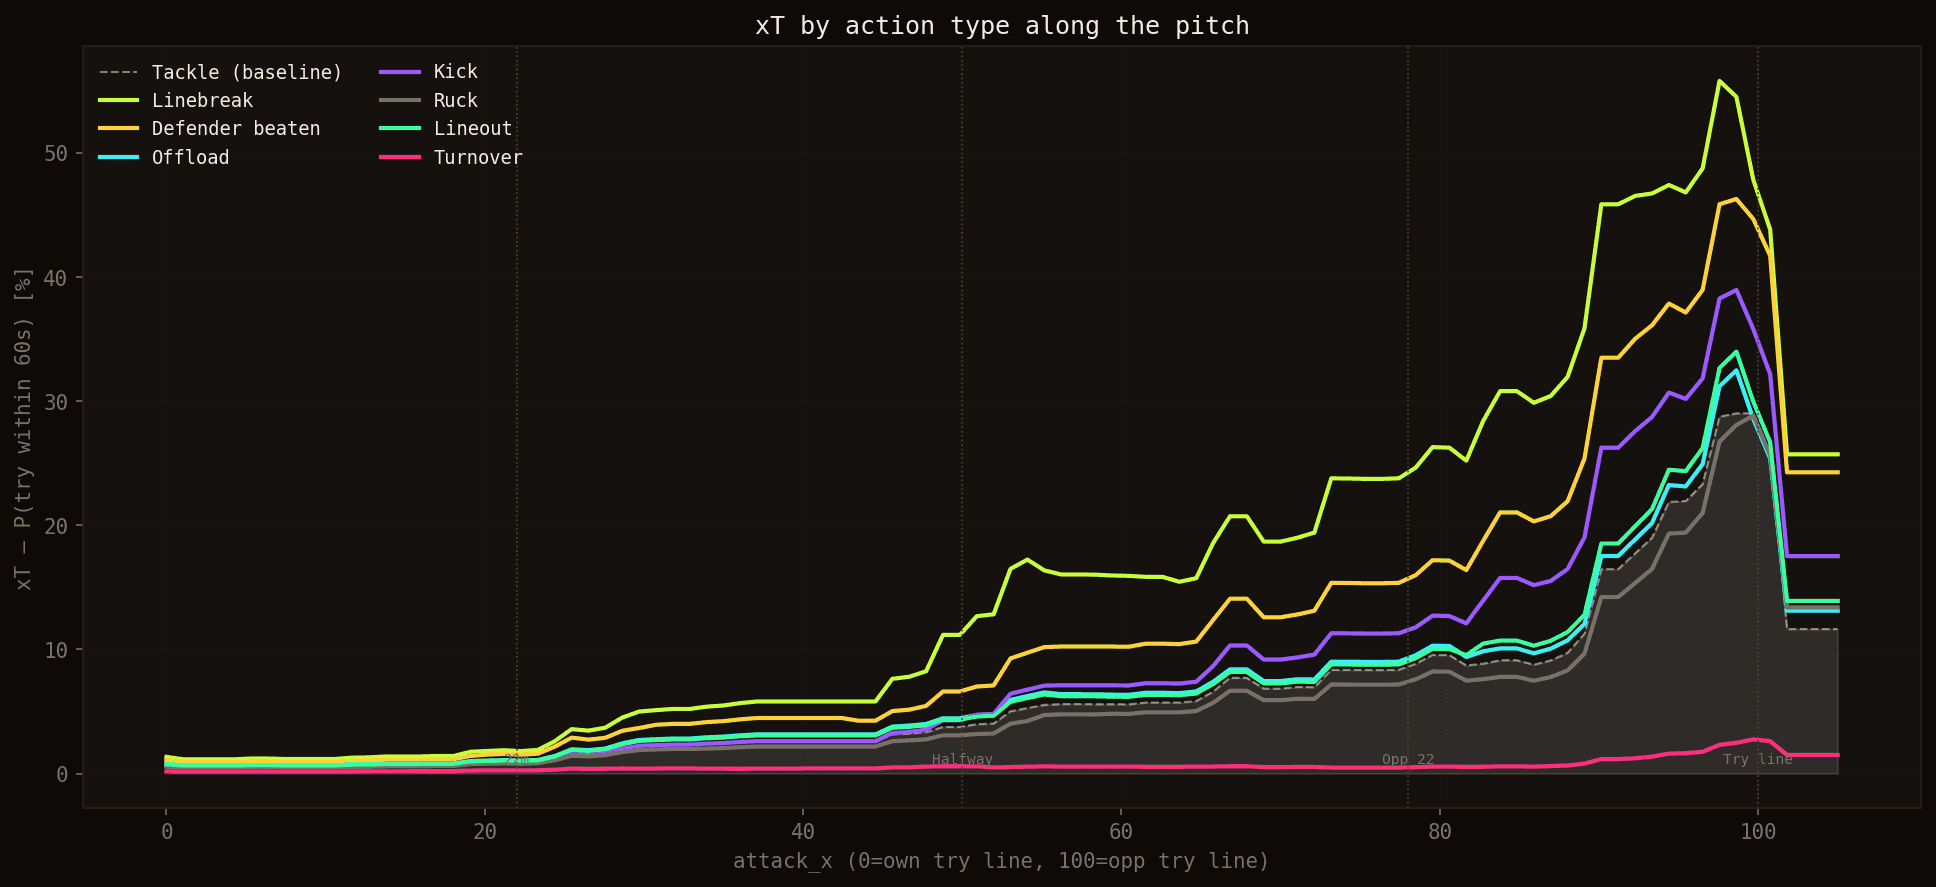
Each curve: average xT for an action type by position. Shaded area = baseline ruck.
What each action adds
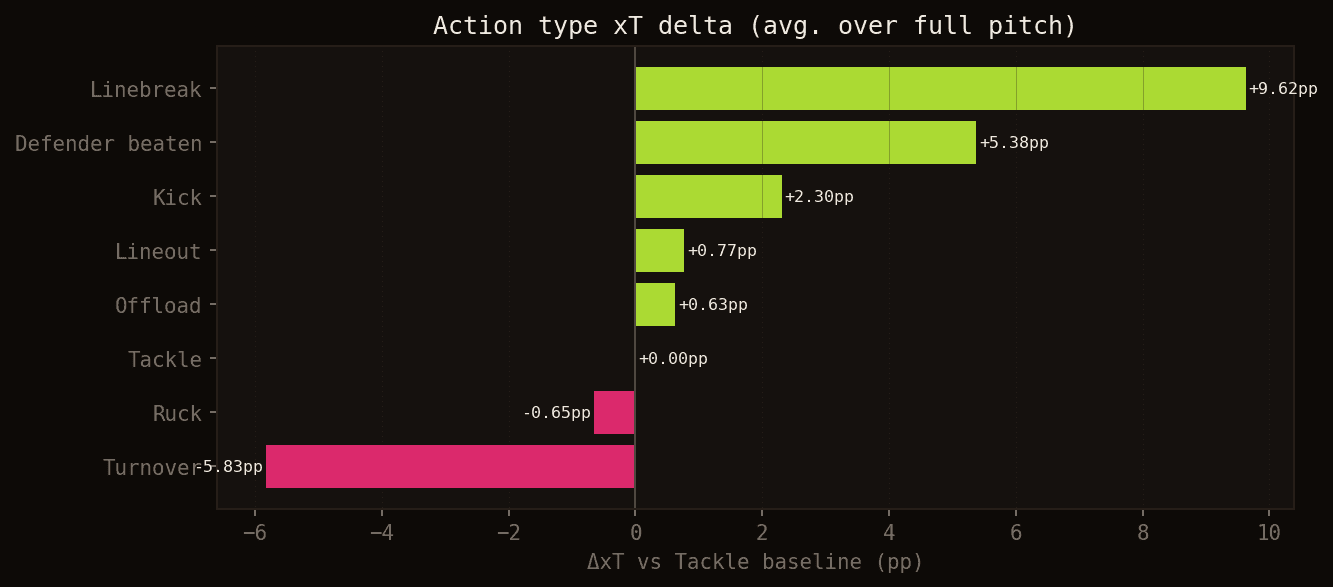
Average xT gain or loss relative to a baseline ruck, averaged across the full pitch.
- Linebreak: +9.6 pp. A linebreak at halfway is worth as much as a ruck 20 metres from the try line.
- Defender beaten: +5.4 pp. Beating one man nearly doubles the danger compared to a standard ruck.
- Kick: +2.3 pp. Attacking kicks aim at the space behind the defence — often a dangerous zone.
- Turnover: −5.8 pp, average xT 0.6%. Losing the ball almost instantly cancels any threat.
8. Which team created the most danger at the 2023 World Cup?
By applying the model to every action across all 48 matches, we can compute two metrics per team: average xT generated (attacking quality) and average xT conceded (defensive solidity).
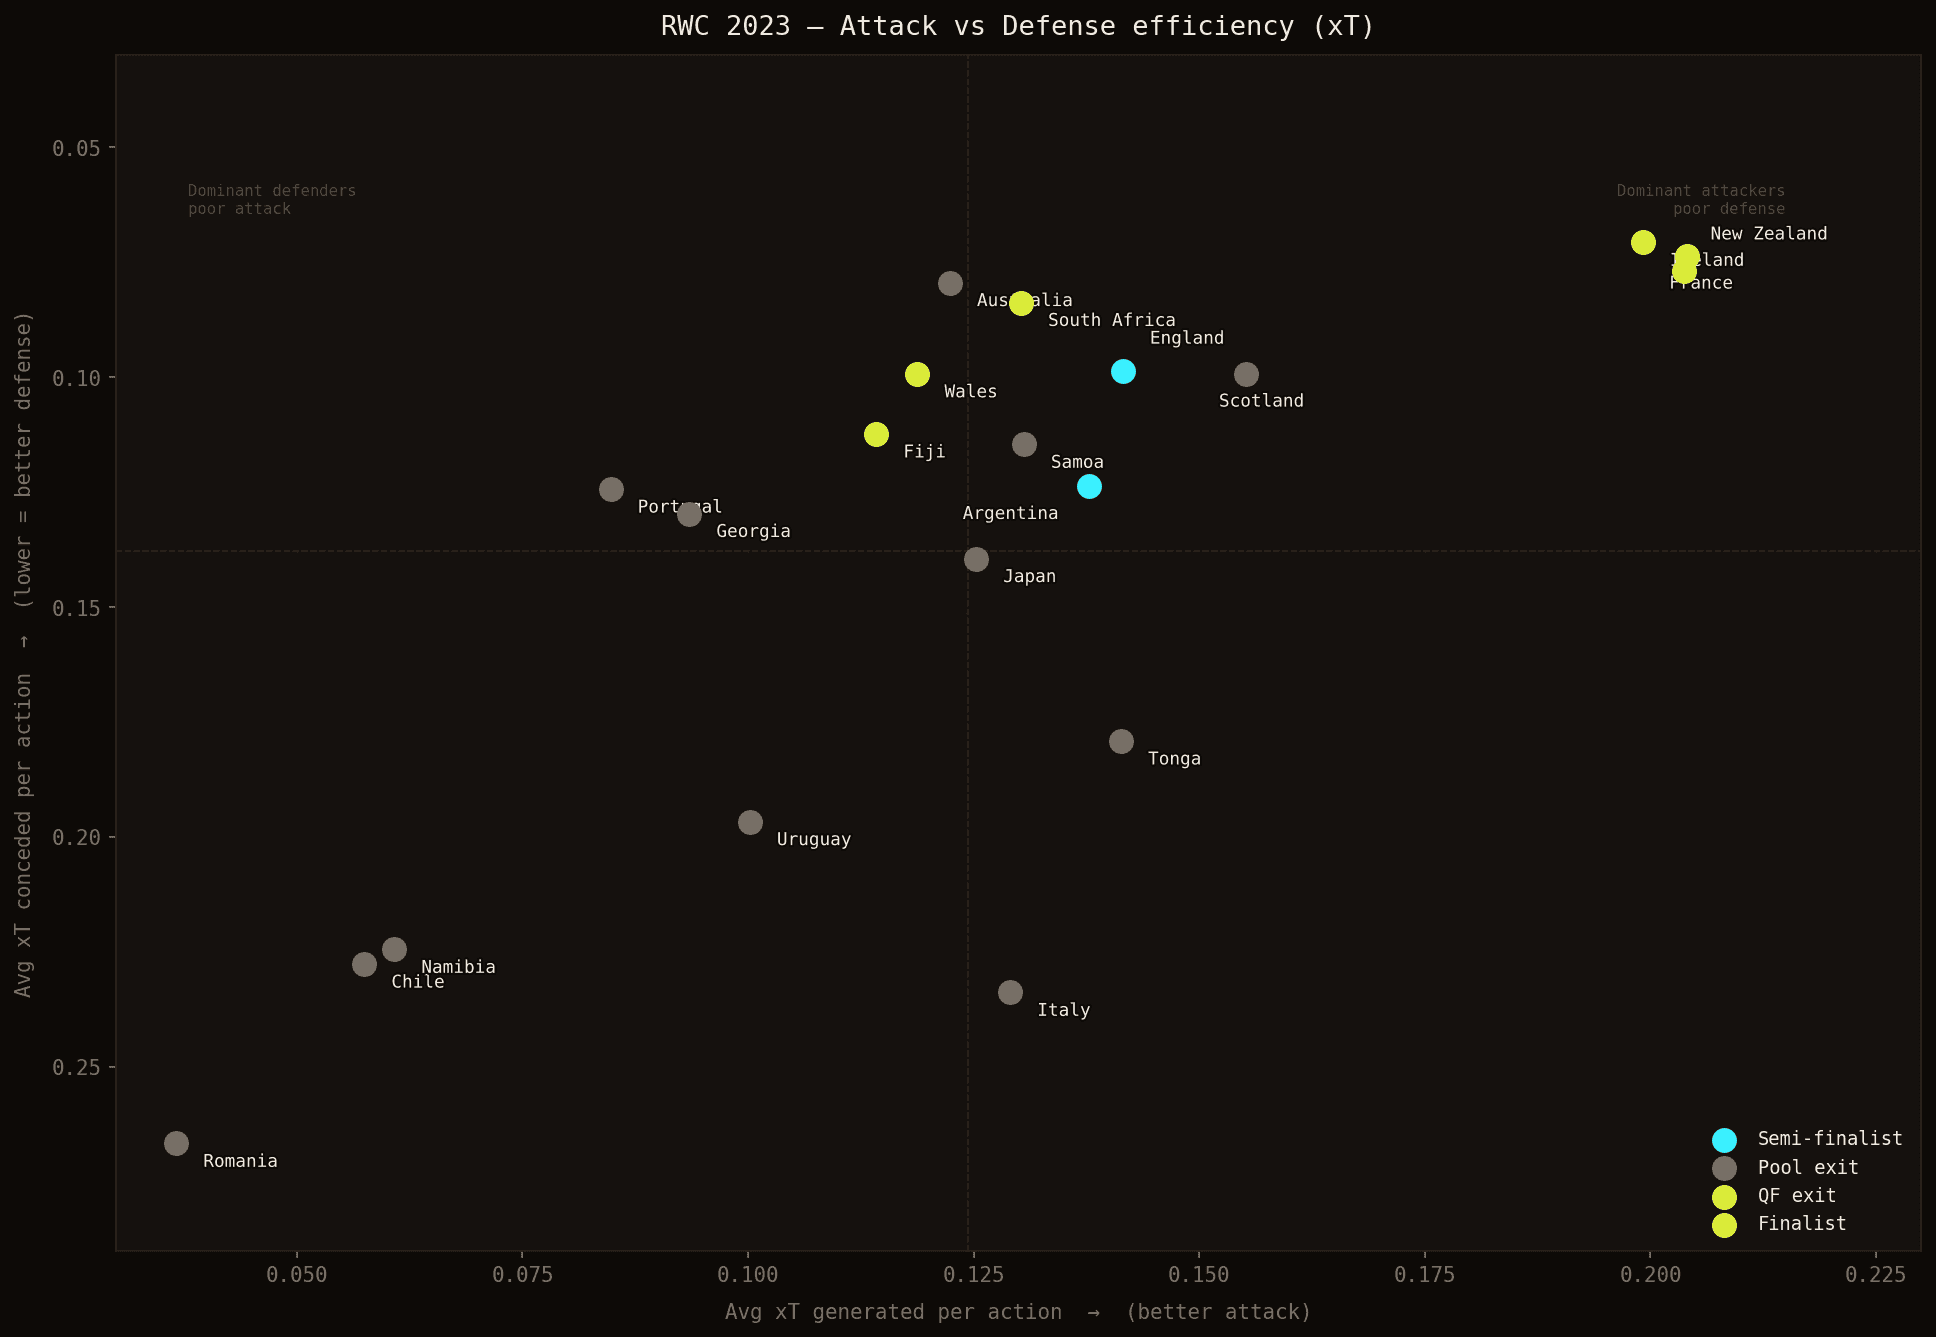
Each dot is a team. Right = better attack. Up = better defense. Finalists in yellow, semi-finalists in blue.
The results tell a fascinating story.
France and New Zealand were the most dangerous attacking teams, both generating an average xT of 0.204 — well clear of the field. Ireland completes the top three at 0.199. These three teams also had the best defences in the tournament.
South Africa, the world champions, were the most efficient team — not the most dominant. With a relatively modest average xT generated of 0.130, but an excellent defence at 0.084 (3rd best), the Springboks built their title on a radically different philosophy: minimising danger conceded rather than maximising danger created. 3.9 tries per match on average — and in the final against New Zealand, they won without scoring a single try.
The French paradox: France generated as much danger as New Zealand and conceded as little as Ireland — the tournament's best attack and best defence by xT. And yet, knocked out in the quarter-finals by South Africa. This kind of gap between xT performance and sporting result is precisely what this type of model reveals — and invites you to question.
9. What the model doesn't capture yet
- Tempo: two rucks at the same position aren't equivalent if one takes 4 seconds and the other 12
- Defensive density: the number of defenders between the ball and the try line
- Specific set-pieces: a lineout 5 metres from the line, a dominant scrum
- Cross-competition generalisation: this model was trained on the 2023 World Cup; TOP 14 and Pro D2 have different playing styles
Conclusion
Expected Try turns every match action into a comparable unit of danger. A linebreak at halfway is no longer just "a great piece of play" — it is a 16% probability of a try within the minute. A turnover in the opposition 22 is no longer just "a turnover" — it is a collapse to 0.6%.
And when applied across a full tournament, xT can tell a story the scoreboard doesn't: France may well have been the best team at the 2023 World Cup by the data. That's sport.
The full notebook and data are available in the project GitHub repository. Questions about the methodology or ideas for applications? Feel free to reach out!